Category Archives: natural-world

How to Eliminating the Boys

Some time ago I was greatly amused by this fine example the  pervasive power of the patriarchy.  Not that it’s surprising; the patriarchy rules!  In that example we discovered that the forces which be have conspired to plant only male trees.  Male trees are good for the economy.  They increase in sales … of allergy meds.

But, there are always contrarians.  So some wags have suggested that we should plant only female trees.  The cover story for why we plant all these allergy generators is that the female trees produce fruit and seeds; better known as litter.  The wags suggest this problem can be resolved if we don’t plant any males.

Of course that doesn’t work since we already have a large installed base of male trees, desperately seeking females.

It occurs to me that a city could pass a regulation to force the planting of female trees, and if they limited those to a species of tree who’s males are not currently infesting the city … well this might work.  Obviously it’s time to short the drug companies.

(Hat tip)

Better sparrows

I received an amazingly over engineered bird feeder for christmas.  It’s primary goal is the frustration of squirrels, though it also has numerous adjustments for the size of the bird.  The next step is obvious.  A bird feeder that only feeds attractive birds.  This would involve a video camera along with some image processing.  Next we could tune the system to place evolutionary pressure on the sparrows: push them toward something more decorative.

So, what was the catastrophe?

I always assume there was a catastrophe.  Something happened.

A hurricane leveled the forest.  A fire leveled the city due to lack of water.  There was a riot.  An economic bubble swept over the landscape.  The troops came home and a swarm of babies appeared.

The system you are gazing at, which seems a given and maybe slightly odd, is the result.  I learned this rule from “Reading the Forested Landscape,”  if you stand in the forest and all the trees are about the same size it tells you when the catastrophe happened.  That works just as well for housing developments.  If you take the rule seriously then one of your first questions is always: what were the  catastrophes?

You can turn this rule around.  Pick your favorite catastrophe and ask how it changes a range of systems.  Catastrophe: Moore’s law, modern managerial practice, the great depression and war?  System: healthcare, civil rights, work?

I was reminded of all this reading an interesting book about the work week, e.g. how long.  I read this book some time ago, so my memory maybe fuzzy.  But broadly starting with the industrial revolution and ending with the great depression there was a broad movement and consensus that the number of hours a person should work each week was and should be declining.

The rational for that trend varied and evolved.  One  argument  was that democracy demands a contribution from it’s citizens and if they were working all the time they could hardly make that contribution.  Civic duty competing with the employee’s duty to his  employer.  Interestingly I don’t recall a religous duty  argument  being mentioned.  Another  argument  was about productivity, e.g. that 12 hours work day didn’t actually deliver much more output than an eight hour day.  I gather the data on that is compelling.  There was a economic  argument  that citizens needed more time off so they could consume more.  And others.

The number of hours worked stopped declining during the great depression and have slowly and  steadily  risen since then.  Apparently that catastrophe changed the framing.  Suddenly people were horrified that the world economy appeared structurally incapable of employing most of the labor.  One reaction to this was that work should be treated as a scarce good with tight regulations to assure it was distributed equitably.  In that framing number of hours worked have an entirely new rational.

The Congress passed 30 hour work week laws twice during the depression.  Both times the President was convinced by industry to veto the new law.  Both times industry assured him that the depression as almost over, so not to worry.  Both times they were too optomistic.

So that’s an interesting example of how a  catastrophe helps to  explains a system.

But he tells a story my thoughts keep returning to.

Apparently, to hear him tell it, the depression caused a huge shift in the way that Science  perceived  and explained it’s role in society.  Before getting into that it might be fun to pause and think: “what is Science’s role in society?”  When I was a kid I recall two common answers: to explain how the world works (often v.s. religion), and the arms race.  But then, pretty much everything’s purpose was the arms race.

Before the depression scientists would appear at the government’s door and explain why they should  receive  funding.  The argument was largely that they were making the world a better place by relieving man of his labors and improving the  efficiency  of industry.  But then, 60% of the planet’s labor was out of work and the scientists woke up to discover that they were getting a share of the blame.  So they were like “Oh!  No!  … ah …  That’s not we meant!  (Could you put down that pitch fork please?)  Science?  Why Science’s social purpose is … ah … ah … new frontiers!  Yeah, that’s it!  We discover new frontiers; and each of these creates jobs!  Why just look at radio and air conditioning!  Lots of job, right?”

Of course Science is not the only institution who’s entire purpose was remade by the Great Depression and it’s spouse the Great War.  Government’s was too.

Water in Boston

The big (10 foot) pipe that brings Boston it’s water has suffered a break and we have all been instructed to boil our water.  I see on the MWRA web site that they  deliver  167 million gallons of water to 2.5 million residents a day.  That comes out to 66.8 gallons per person per day.  Of course they also deliver water to industry … and more typical leaks.

The paper says that the leak was dumping 8 million gallons an hour into the river.  167 gallons/day is equivalent to about 7 million gallons an hour.

This water is drawn from some resevours in the middle of the state.  The largest of which holds 417 billion  gallons, or 6.7 years to draw down at 167 million a day.

Sardine

The library of congress has an wonderful collection of photographs taken at sardine packing plants.  Thus I came to learn the word cartoner.  Which was once a person, but is now a machine.      Today comes news that the last such cannery in the US is shutting down, along with a few pictures.  This all resonates against a conversation my wife and I had yesterday about how maybe none of the high tech companies that were in Boston when we moved here in the late 70s still exist.

The Bimodal Nature of Work

One of the things that puzzles me about the vast literature on organizational dynamics, self control, will power, etc. etc. is that it seems to ignore an important reality about actual work.  In my experience work comes in two flavors – everything is going just fine v.s. stuck.  In the first mode you think you to know what your doing, the tools are reasonably helpful, and the problem at hand is receding as you work on it.  That’s not to say the work is easy, it’s still work – unless your so lucky as to fallen into flow.  But in the other mode one or more of these has decided to leave the building.

Users of complex tools are familiar with this bimodal problem.  if you use any powerful desktop application (a Microsoft product, or an Adobe product for example) then you’ll have often experienced the second mode.  We have all lost a day or two trying to figure out how to make page numbers work, the bibliography to appear correctly, etc. etc.  These are examples where our skills and the tools conspire to push us into the second mode.  The no progress mode is being made mode.

The more you push the edge of your skills or adopt new tools, or work on fresher problems the higher the chance your going to fall into this second mode.  I suspect some trades spend large portions of their work lives in this second mode.

It is trivial for an outside observer to misdiagnosis the second mode and describe the situation as not working.  He’s happy to point out that no progress is being made.  Duh!  And he’s happy to dust off all the usual suspects; e.g. moral failings of various kinds.

You can see occasional hints that this or that an organizational scheme addresses this by the appearance of terms like “management reserve,” “friction.”  In Scrum the use the term velocity.  But none of these dare to admit that work falls into the second mode.  None of them speak to the puzzle of how to estimate the probability of entering the mode.  None of provide any advise for picking apart what is happening in the mode, which is a precondition for getting out of it.

The skills for thriving in this mode might be called persistence.  That’s really a distinct skill from skills that keep you on task in simpler times.  At least I think so.  The will power to maintain focus is somehow different than the willpower required to survive a long period this second mode where no measurable progress is being made.  And while persistence is one strategic approach an alternate one could be named agility, aka change course.  Again the moralistic outside observer might see that as quitting.  The complementary pair of persistence and agility reminds me of  Levy walks.

Buying in Bulk

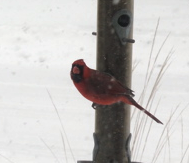
I gather that my mother in law once bought a case of dog food only to have the dog die.  We recently bought a big bag of bird seed and now the birds have disappeared.

I was watching a talk about “grit”, which I think the rest of us would call perseverance.  And the speaker was explaining the usual story about how it takes 10 thousand hours of dedicated practice to become an expert in something.  It’s hard to find anything in computing that’s lasted ten years.  There are somethings.  Those guys really don’t fit in.

World Mapper

I continue to be a fan of the cartograms at world mapper.  And I see they now have regional and national maps.  For example here is one where the grid squares are proportional to the  population across the Caribbean.

And another for  population in the US.

(with luck this will be the first posting done via the  Postie plugin for WordPress, which pulls email (rich text in this case) via inserts it into your drafts, published, or whatever.  You can grab a free email from one of these services, just be careful to get one with imap or pop3 support.)

Haiti

This map shows the risk of earthquakes for areas in the  Caribbean.

And this is the same map showing Haiti more closely

And this map shows where the first earthquake struck, and the following map shows one of the aftershocks.  The capital city Port-a-Prince is labeled on the second map.

Those are ‘shake maps’, estimates of how severe the shaking was.  The dark red is ten, or X, and here’s what the key says:

VIII - Drivers have trouble steering. Tall structures such as towers,
monuments and chimneys may twist and fall. Wood frame houses that
are not bolted to their foundations may shift and sustain serious
damage.  Damage is slight to moderate in well-constructed buildings,
considerable in poorly constructed buildings. Branches are broken and
fall from trees.  Changes occur in flow or temperature of springs and
wells. Cracks appear in wet ground and on steep slopes. 

IX - Masonry structures and poorly constructed buildings suffer serious
damage or collapse. Frame structures, if not bolted, shift off
foundations. Serious damage to reservoirs.  Underground pipes broken.
Conspicuous cracks in the  ground. In alluvial areas, sand and mud
ejected and sand craters are formed.

X - Most masonry and frame structures destroyed along with their
foundations.  Some well-built wooden structures and bridges are
destroyed.  Serious damage to dams, dikes, and embankments. Large
landslides occur.  Water thrown on the banks of canals, rivers and
lakes.  Sand and mud shift horizontally on beaches and flat land.
Rails bent.

Those mountains are huge, four thousand feet.  So the population is more densely packed than this map suggests.

You can see there is an extremely densely populated valley crossing the peninsula very close to the epicenter of the first quake.  But that doesn’t really agree with this population map, which I tend to trust more since they care more about how population is actually distributed.

The contour lines, in blue, on this map, are at thousand foot intervals.

Ok, here is a profesional effort to estimate the population exposure.  Click here to see the map.

As usual the Globe’s Big Picture has excellent coverage.

Shortly after Katrina NOAA took detailed arial photographs of the entire gulf coastline and put them up on the web.  Does anybody knows of a similar effort for Haiti?