Category Archives: power-laws and networks

Rondevous: lower life forms

My father liked to order things off the menu he had never eaten and then cheerfully attempt to get his children to try them. This is a cheerful kind of cruelty that I have inherited. We often told the story in later years of the time we ordered sea urchins in a dingy chinese restaurant in New York. The consensus was that the sea urchins weren’t actually dead when they got to the table. They would go in your mouth and when they discovered you were attempting to chew on them they would quickly flee to the other side of your mouth. Being a very low life form once you had succeeded in biting them in two your reward was two panic sea urchins in your mouth.

I’m reminded of this story by the fun people are having with neologisms these days. For example blog, or folksonomy. A neologism is rarely a very highly evolved creature, which makes it hard to pin down. But there in lies the fun. You can have entire conferences about a single word because collectively nobody really knows what the word means. These littoral zones are full of odd creatures. The tide of Moore’s law and his friends keeps rising. The cheerfully cruel keep finding things to order off the menu.

But, before I got taken prisoner by that nostalgic reminding, what I want to say something about is this definition of ontology that Clay posted this morning.

The definition of ontology I’m referring to is derived more from AI than philosophy: a formal, explicit specification of a shared conceptualization. (Other glosses of this AI-flavored view can be found using Google for define:ontology.) It is that view that I am objecting to.

Now I don’t want to get drawn into the fun that Clays having – bear baiting the information sciences.

What I do want to do is point out that the function of these “explicit specifications of a shared conceptualization” is not just to provide a an solid outcome to the fun-for-all neologism game.

The purpose of these labors is to create shared conceptualizations, explicit specifications, that enable a more casual acts of exchange between parties. The labor to create an ontology isn’t navel gazing. It isn’t about ordering books on the library shelves. It isn’t about stuffing your books worth of knowledge, a tasty chicken salad between two dry crusts – the table of contents and the index.

It’s about enabling a commerce of transactions that take place upon that ontology. Thus a system of weights and measures is an ontology over the problem of measurement and enables exchanges to take place without having to negotiate from scratch each time, probably with the help of lawyer, the meaning of a cord each time you order fire wood. And, weights and measures are only the tip of the iceberg provide the foundation for efficient commerce.

But it’s not just commerce, ontology provide the vocabulary that enables one to describe the weather all over the planet and in turn predict tomorrow’s snow storm. It provides the the opportunity to notice the planet is getting warmer and to decide that – holly crap – it’s true!

To rail against ontology is to rail against both the scientific method and modern capitalism. That’s not a little sand castle on the beach soon to be rolled over by the rising tide. Unlike say Journalism v.s. blogs, it’s not a institution who’s distribution channel is being disintermediated by Mr. Moore and his friends. Those two are very big sand castles. They will be, they are being, reshaped by these processes but they will still stand when it’s over.


What really caught my attention in Clay’s quote was “shared conceptualizations.” Why? Because sharing, is to me, an arc in a graph; and that means network, which means network effect, which means we can start to talk about Reed’s law; power-laws, etc. It implies that each ontology forms a group in the network of actors. To worry about big, durable, or well founded these groups are it to miss the point of what’s happening. It’s the quantity, once again, that counts.

What we are seeing around what is currently labeled as folksonomy is a bloom of tiny groups that have rendezvous around some primitive ontology. For example consider this group at flickr. A small group of people stitching together a quilt. Each one creating a square. They are going to auction it on eBay to raise funds for tsunami victims. For a while they have taken ownership of the word quilt.

What’s not to like? The kinds of ontology that is emerging in examples like that is smaller than your classic ontologies. These are not likely to predict global warming, but they are certainly heart warming.

This is the long tail story from another angle. The huge numbers, excruciating mind boggling diversity, billions and billions of tiny effects that sum up to something huge.

Tail wagging

Something has been bugging me about Chris Anderson writing on the long tail. Part of what helped to clarify my concern was the recent postings seeking a fun short definition for the long tail. Most of these are economic – so that’s part of my problem the long tail isn’t just about economics. It arises in all the social sciences. Mapping all the social sciences into economics is lame. It arises outside the social sciences as well, in physics, geology, in network systems, to take a few examples. Of course it’s fine if he want’s to focus on the long tail as they arise in markets and pseudo-markets; it just makes me a bit uncomfortable.

If you focus down in on power-law distributed systems that appear in economic frames there are at minimum four flavors to be taken seriously. Consider the supply chain: producers, consumers, distributors, and standards. All four are power-law distributed. All four have long tails. You need to think thru all four. In this case my discomfort is lame. You have to start someplace, so starting out by noticing the long tail in the suppliers is as good as anyplace to start.

Failing to think thru the four players leads to a blind spot about the architecture of the emerging market.

The internet is disrupting existing distribution channels. I believe that when the dust settles the distribution channels will be much much more concentrated than they are today. That the power-law’s slope will be much much less egalitarian. If true the distributors will capture most of the revenue enabled by the supply/demand found in the long tails. That will create some really cruel power imbalances. For example; if the only way to get your back listed catalog into the hands of consumers is Amazon why wouldn’t Amazon demand a large share of the sale price. To put this another way, I suspect that Amazon’s margin is much higher on long tail sales. Such sales are a double win for Amazon.

The Equality of Mother Nature’s Aches and Pains

Since writing my recent posting on the power-law distribution of the population of earth quakes I’ve been drawing making connections in my noodle between that and the distribution of income. The distribution of income is the first thing that drew my close attention to power-law distributions. The distribution of income reveals how various actors in the economy manage to capture shares of the product of that economy. The distribution is more or less equitable in this or that economic system; but it’s always a power-law with a very small handful capturing the vast majority of the income being produced.

The distribution of earthquakes displays how various actors, individual earthquakes, capture a proportion of the total energy created by Mother earth’s aches and pains. Out on the long tail pebbles bounce down hills. It’s difficult to get a feel for exactly how much energy is released out there. If we included such tiny events then the percentage of events labeled as earthquakes would be very slight. Let’s ignore that long tail.

You can get a feel for the energy distribution from the following chart. This is the same data as the last post, but this time we plot a running total of the total energy released by the population of the largest few thousand earthquakes of the year 2000. Starting from the smallest one we sum them up until we get to the biggest one. You can see that even in this small population the vast majority of the energy released is owned by a small percentage of the actors.

Energy released by the top 5000 quakes of 2000 accumulating from left to right.

The largest quake in 2000 was a magnitude 8. You can see it’s contribution to the total 2000 quake energy of that year in the vertical space between the last two points. That gap would be 32 times larger for a magnitude 9.

Looking at just the few thousand big earthquakes from just one year is like modeling the wealth distribution by studying suburban Americans.

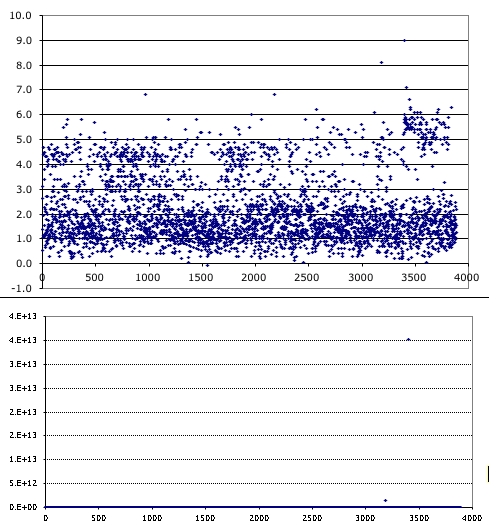
Another way to see this is to look at the earthquakes (source: ftp) in December of 2004, i.e. last month. These two charts show those quakes; the first chart plots them all in serial order versus their magnitude. Notice two things. First there are two large quakes; the second one triggered the tsunami. The first about a week earlier was in the pacific south-east of Australia. Second, note the cluster of after shocks, i.e. the quakes of magnitude 5..6 toward the end of the month; following the magnitude 9 quake.

The earthquakes of dec 2004.

The second chart is identical to the first except it plots the energy released rather than the magnitude. On this chart only two quakes of nearly 4 thousand are notable, not even the aftershocks. None of the quakes in 2000 were this large. Makes me wonder what Mother nature is capable of.

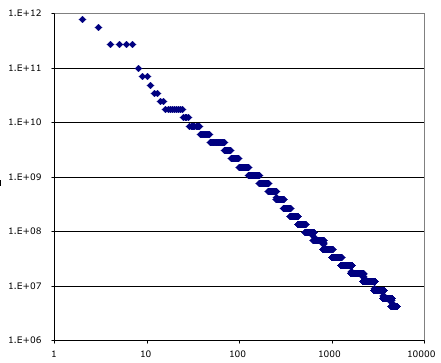
Earthquake intensity is powerlaw distributed

Distribution of the top 5 thousand earthquakes in the year 2000.The chart on the right shows one point for each of the top five thouand earthquakes in the united states during the year 2000. The largest was a magnitude 8 and appears in the upper left and is plotted as rank one on the horizontal axis (well, it would if I hadn’t dropped the top point, so the second largest is in the upper left). The smaller the earth quake the larger it’s rank order on the horizontal. The vertical axis is the energy released by the earthquake, estimated from the reported magnitude. This grainy look of the plot is because the magnitude was reported using only two digits. The data is from here.

In conclusion the distribution of earth quake sizes is a power law. The social network of dirt?

Frustrating condensation

Two stories about the slope of the power-law curve; both drawn from a delightfully rich book about the suburbs that I’m reading.

First, steam engines.

Steam engine trains were slow to attain speed and then they were slow to decelerate. Cities in the Eastern United States developed railroad suburbs at one point in the 19th century. Developers would buy up land on the periphery, build a railroad line and then sell the fantasy of suburban living to the well to do. The nature of steam engines meant that the stations on these lines were pretty far apart; often 2-4 miles apart. Residents around each village would walk to the station so the developments appeared as beads along the line with gaps between that remained undeveloped.

Second, city size.

The largest city in the United States is … Anchorage Alaska!

The presumption in the 18th and 19th century was that the destiny of a successfully village was to become a city. That villages were seeds that grew into mighty cities. The states arranged their laws to enable this presumably natural evolution. As a village grew it would fill out some forms, petition the state, and mature to the next level of status. Each status brought with it more governance powers.

At the same time growing cities would absorb their peripheries. A thriving city would annex the periphery to provide additional space as the city expanded. The platform of services provided by the city (sewage, water, paved streets, police, education, economics…) provided an attractive force. A crisis in the service infrastructure of the peripheral communities might accelerate the condensation; riots on the periphery, water supply problems, etc. Sometimes the developers and their transportation overlays drove the process. They wanted the promise of city services in their brochure, so they would push for annexation.

Starting with Brookline in Boston this all changed. As the cities expanded they began to reach the railroad suburbs. The railroad suburbs were run by a very wealthy class. Since the wealthy needed support services and there was little alternative transportation the working class lived adjacent to their employers. For these communities the spreading urban periphery looked pretty threatening. They weren’t being offered union with the thriving downtown; they were being offered union with the rough unfinished edges.

So when the time came in the natural order of things for the city to annex these well off parts of the periphery these well connected communities declined. Brookline was the first. In many parts of the country that turned out to be reasonably easy to do. All they had to do was petition the state to move up a notch or two on the evolutionary ladder toward becoming a city.

The result was east coast cities were soon encircled by a choker of small incorporated villages. The cities stopped growing.

Historically annexation is the single largest means of increasing a city’s population. Cities in parts of the country that didn’t suffer this pattern have kept growing and thus a city like Houston has grown a lot while older cities like Boston haven’t. For reasons that I’m totally unaware of Anchorage is really vast, in land area.

I see this thru the lens of the power-law distribution. First that the technology of the steam engine frustrated condensation. Secondly that a happenstance of governance coupled with the legacy of the railroad suburbs frustrated the condensation of the cities.

The trade off made in these condensation stories is always between the efficiency of a unified standard versus the diversity of a mess of different standards. There is an interesting tail to tell about how these cities who’s growth was frustrated sought out means to work around the inefficiencies it created. Regional authorities began to emerge; for example regional water, school, trash, police districts. These are substitutes for city governance. In some cases the state became the locus for provisioning the platform of necessary services.

Efficency of Exclusion

I had breakfast the other day with a friend who was involved in a group ware company for many years. He introduced the very amusing idea that a good platform strives to be like Seinfeld; about nothing. That’s got delightful synergy with both the idea that a platform vendor strives to create a huge space of options for his developers as well as the the idea that the long tail is impossible to describe.

Then the discussion turned to group ware. We got to talking about the corporate culture shaping power of software.

The first time I observed that was with bug databases. The arrival of a bug database into a project always has a startling effect. It creates a way of organizing the work, call it BD, and it often rapidly displaces other means of organizing the work, call them OM. BD wasn’t just the bug database; it was a entire culture of how to work. Little things happen, for example, dialogs about the issues emerge in the bug comments and if the tool supports it these dialogs become central to the work. Big things happen like the emergence of entire roles such as bug finder v.s. bug fixer. Anxiety managers quickly learned how to leverage the BD culture. It’s a machine who’s crank they can turn. On the one hand, this was all just great.

But BD had a strong tendency to displace other methods, or OM. OM always lacked a name. It wasn’t a single thing you could name; it’s not even a small integer of things. BD doesn’t cotton to redesign or analysis. BD fails at solving any issue above a certain size. BD had a strong tendency to glue problems to individuals. All these preferences and tendencies of BD are a good thing, except when they weren’t effective.

I can recall a occasions when I would get a large problem solved only by changing the person a bug or collection of bugs was assigned to into a team. Conversely there are situations where the right answer was to assign a bug to a nonexistent person – i.e. the person not yet hired or the person who understands this mystery but who didn’t know it yet.

What was unarguable about the BD culture was it’s efficiency and efficacy. Sadly, in the end it excluded the the other methods required to solve key problems. Looks like a nail cause i got a hammer thinking would begin to dominate. Product hard to use, open a bug. Product starts up too slow, open a bug. Customer learning curve too steep, open a bug.

The BD v.s. OM syndrome has a second kind of displacing syndrome. Individual contributors quickly realize that if they want to part of the work culture they need to get hooked up and pay attention to the evolving BD status. This creates a network effect that strengthens ties between the BD culture and the labor. Which is good for the BD culture; but it’s train wreck if hired a given person for his exceptional skill that happens to be a member of the set of other methods. For example you’ll observe the graphic designer wasting a few hours a day reviewing the bug database status and individual bug updates so he can be a clueful participant in the work flow – but since you didn’t hire him for that it becomes cost not efficient.

In chatting with my friend the example we got to talking about was group calendaring. We had both experienced a syndrome where the firms we were working in had installed a group calendaring tool and almost immediately the firm’s entire problem solving culture had been transformed. In this case a GC culture would displace OM.

In the GC culture it’s easier to schedule meetings so you get more meetings. The software has strong opinions about meeting granularity; so you get mostly one hour meetings. Meetings tend to be family sized. The software makes it easy to invite more people, so more people get invited. Meetings by their synchronous nature are exclusionary. Not wanting to appear exclusive with members of the extended family of coworkers people tend to invite additional people. People, concerned about what might happen behind the closed doors of those meetings tend to accept the invitations.

That feedback loop that tends to push meetings toward family sized is the GC culture equivalent of the graphic designer wasting his time reading all the dialogs on bugs. You get brilliant team members attending 3 hours of meetings a day because they happen to know that once or twice during those three hours they will say “Ah, I’m not sure that works.” I’ve seen corporate cultures where that’s considered a day’s work for a brilliant guy. “I’m so happy you came to the planning meeting! You really saved our butt.”

This is, of course, part of the problem of the long tail. The organizational culture that adopts one of these highly efficient methods, call that EM so that BD or GC above are examples of EM, develops a power-law among it’s members. Those members who adopt EM enthusiastically gain a place higher up the curve then those who stick to the core competency. They become the elite and all the usual polarizing forces come into play.

None of this requires the introduction of Machiavellian agendas by the players. People are just “atoms in a jar” as the forces play out: synchronization, efficiency, displacement, cultural network effects, and emergence of the elite and consequential polarization.

I don’t think it’s over generalizing to say that when ever you introduce an synchronizing device you gain some degree of measurable efficiency at the cost of displacing nameless uncountable other methods that don’t synchronize well with the method you’ve adopted. If you can’t name them then it’s going to be even harder to measure them. Why bother to even try if they are uncountable.

Romanticization of the Long Tail

Girls Just Want to have FunHere’s a fine critique of a common kind of delusion that arises when people think about the nature of the long tail. This is the intro to a New Yorker music review.
“World music” is a category that does nobody any favors. Entirely disparate performers, liek the dapper Brazilian singer-songwriter Caetano Veloso and the African blues guitarist Ali Farka Toure, get lumped together in American record stores simply because they don’t sing exclusively in English. Also, European and American pop have saturated the world to such an extent that Kyle Minogue and Tupac are now more world music than, say the Malian singer Oumou Sangare. Finally, most of what you find in the world-music section tends toward the gentle, melodious, and uplifting, as if the world were that way.

World music is the long tail. The process renders that long tail as melodious and uplifting? Romanticization.

Very hard to generalize about the long tail. It’s only attributes are: huge scale, exceptional diversity, and poverty. Well “poverty” if your measuring stick marked off in units that are useful for measuring the wealth of the elite. That marking stick, useful for the elite, is useless down in the long tail.

Melodious – it reminds me of the way that people who run developer networks like to say that developers “just want to have fun.”

You can not think about this!

As an advocate for the power-law distribution one frustration is how difficult it is to visualize. You can use examples like Mark Twain’s delightful description of evolution: “Man has been here 32,000 years. That it took a hundred million years to prepare the world for him is proof that that is what it was done for. I suppose it is. I dunno. If the Eiffel tower were now representing the world’s age, the skin of paint on the pinnacle-knob at its summit would represent man’s share of that age; & anybody would perceive that that skin was what the tower was built for. I reckon they would. I dunno.” I.e. those at the top of the power-law wealth distribution it makes no sense to bend over and pick up a thousand dollar bill.

We generally assume that things are distributed uniformly. The rain, for example, falls reasonably uniformly overy my back yard. These systems with power-law distributions aren’t like that. They are more like some freak storm passing by and dropping all it’s rain into a bucket in my yard.

One of the classic examples of a power-law distribution is the size of cities and towns. Stop and think what that means. It means that every time you look at a geographic map of which displays some human activity your being horribly mislead. Because humans are spread out evenly like the rain in my backyard. Instead they are all concentrated in a handful of buckets. In New York, Paris, Hong Kong, etc. etc. large regions of the city have from a quarter to a million people per square mile. It is as hard to think about that as it is to think about men who’s income is so high they ought not reach down and pick up a thousand dollars.

It’s no help trying to address this problem by telling outlandish stories like the ones above. The listener’s mind just locks up and switches over into denial. For example, if I say that social networks are power-law distributed what should you immediately think? You should expect to find people who’s place in the social network is like the lower east side of Manhatten; who are like the skim of paint on top of the Eiffel tower. Can you think about that?

If people can not think about these distributions what is one to do? If people can not get into their head any reasonable model of rich the rich are, or how dense real cities are, or how long evolution takes how can we expect to work thru the consequences of these facts?

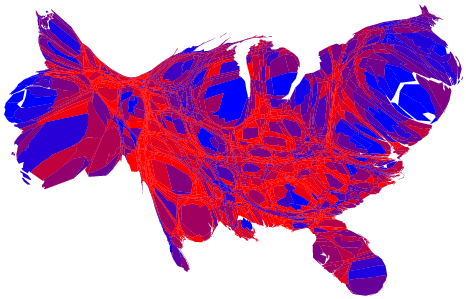
Visualization of data is one possiblity. One possible technique is the cartograph. For example here’s a nice short article by the Mark Newman that tries to give a more accurate visualization of the last election.

A drawing like that is just barely accessible. Notice that how you can see San Fransisco bay on that map. Notice the scale of Long Island.


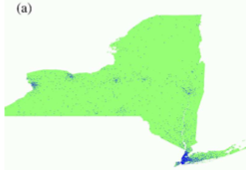
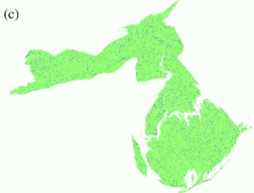
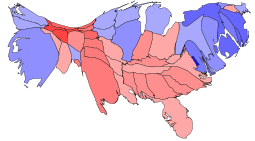
That map was drawn using technique outlined in this paper. That paper includes some wonderful examples of how hard this kind of visualization is. For example here are two maps of the 2000 election. The more distorted, and hence somewhat more accurate, map reflects a more accurate model of were the population lives. New York, New Jersy, Massachusetts, and Pennsilvania all become distorted to show where they have urban centers. But even maps like this can’t quite capture how dense the population really is in places like Manhattan.


That paper also has a very nice example of how important it is to get this right. In this example we look at cancer cases. In the first drawing we can see that if your looking to find somebody with cancer you’d best go to NYC. But that is an entirely different from saying that NYC is a place where your likely to get cancer. In the second drawing the incidence of cancer looks almost entirely independent of population density; just the slightest sign that Love Canal near Buffalo and the poor districts of upper manhatten and the south Bronx might be problem areas.

But again second map certainly doesn’t look at all like New York State. In fact it’s proably a good rule of thumb that when visualizing data about human society if the drawing bears any resemblance to something in the physical world your probably about to be mislead.

This is the problem. How can we get people to think constructively about systems that are inherently hard to think about?