Category Archives: power-laws and networks

Just insert a translator

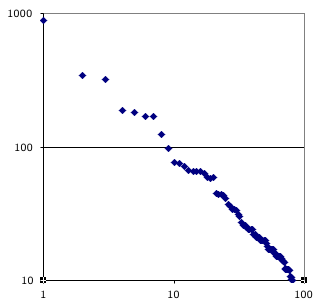
Distribution of the top 80 languageThe chart at the right shows has a dot for each of the most popular languages spoken on the planet. It’s plotted on a log-log graph; the vertical axis is millions, the horizontal is rank. The top language is Mandarin, though there are seven other Chinese langages in the top 30. English and Spanish are neck and neck for second place. The data is from here, though originally from here.

This posting is the complement to the posting on the cost of free trade born by the subordinate culture using which side of the road you drive on as well as the argument being made in my recent advocacy posting regarding RDF/N3 v.s. XML that translators can gloss over the difference.

As global barriers fall this distribution will grow more severe. Like an industry condensing toward a monopoly. Smaller languages will expire; larger languages will thrive. Rankings will shift because there are other forces in play; like control over economic exchanges. Anybody got a babble fish?

Aggregating the long tail.

This article is important.

“…a digital jukebox company whose barroom players offer more than 150,000 tracks…”

“….The average Barnes & Noble carries 130,000 titles. Yet more than half of Amazon’s book sales come from outside its top 130,000 titles. …”

“… successful businesses on the Internet are about aggregating the Long Tail in one way or another. Google, for instance, makes most of its money off small advertisers (the long tail of advertising), and eBay is mostly tail as well – niche and one-off products. …”

Go read it.

Industry Consolidation and Powerlaws

Conventional wisdom holds that standardization is a means to create increased competition. This is not always the case. Conventional wisdom holds that deregulation is a means to increase competition. This is not always the case. Regulation and lack of standards are two ways that can frustrate the consolidation of small firms in an industry into larger firms.

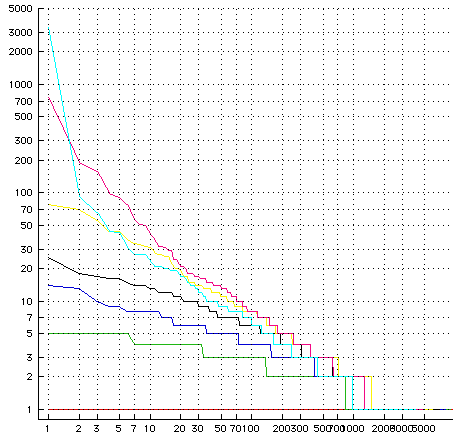
This graph is an output of a simulation of an industry undergoing consolidation. The lines show the distributon of firm sizes in the industry. Each line on the log-log graph is one step toward a more consolidated industry. The line along the bottom shows the industry at the start of the simulation; a ten thousand firms all of size one. As the simulation proceeds firms merge; each merger creates a larger firm. Each line show the distribution of firm sizes after another hundred firms have been absorbed until there are only four thousand firms left; but notice that one of these firms has captured three thousand of the original firms in the market! Now that’s a way to concentrate wealth!

An Industry Consolidating

You can see the power-law distribution of firm sizes emerging spontaneously as the consolidation takes place. I.e. this is another means to create a power-law distribution.

Let’s peel back a bit more what’s going on here. This model is based on what graph mavens call a random graph. Each of the original firms is a node in this random graph. To start their are no links at all between them. The simulation proceeds by creating random linkages between these original firms. As links are introduced groups of firms are consolidated into now merged firms; or in graph theory terms you get connected components. Clearly if we do this long enough we will get one giant firm. That is often referred to a a phase transition; in which case we might say that the industry condensed or froze rather than consolidated.

Note that this model creates links between the original firms, so that a firm that is consolidated out of 100 of the original firms is a 100 times more likely to get a random link than one of the original firms is. That creates the usual rich get richer as well as the advantage to the early mover found in the power-law scenarios. The random nature of the linking also reminds us that there is no “merit” revealed by the distribution other than size and luck. Consider what that implies for the sleepy members of an industry the moment that the regulatory (or technological) barrier to consolidation is repealed and suddenly what was impossible before; mergers, are now key to the firm’s ongoing survival.

In the last step in the simulation graphed here you can see that the power-law distribution is on the verge of failing to provide a good fit; the industry is about to freeze up into one giant monopoly.

Both regulation and a lack of standards make it harder to create the random linkages that encourage this kind of consolidation. Something to keep in mind when chatting with the advocates of standards, deregulation, and free trade. Something to think about when large firms argue that deregulation and standards are good for small business. Something to think about when free trade advocates argue that free trade is an unalloyed good for small countries. It is more complex than that.

Continue reading

Growing Powerlaw Networks

I note two other processes that grow a power-law distribution in Newman’s survey paper. The first is a variation of the preferential attachment model. I think of that as a shopping model. New nodes shop for what to connect to. The first of these two models has a different method of shopping.

The alternate shopping model fixes a problem with the preferential attachment model. If you look at the simulation for the preferential growth model it works by drawing a random existing connection and them mimicking that. This is not really credible. The new nodes don’t have a view of the set of all the existing connections to draw upon. Newly arriving nodes presumably can only see some local region of the network.

The alternate shopping model replaces the random draw with a bit of search. The new node starting from a random existing node proceeds to either continue searching (shopping) at a neighbor of that node or it stops shopping and mimics a connection on at that node. Each round of the search has some chance of terminating v.s. iterating. Like the preferential attachment model this shares a random draw from the universe of the whole graph. I’m particularly pleased because simulations of this model can easily be modified to include other attributes of the nodes the shopping visits – i.e. merit.

The second model might be called the acquisition model. Newman reports that if create a network by randomly adding edges between random nodes there comes a time when the network very quickly becomes entirely connected. They call that a phase transition. As we approach the phase transition the nodes form a slurry of components of various sizes. The distribution of these sizes is power-law. I think of that as an acquisition model because it mimics to a degree what happens in as an industry matures. At first there are numerous small entrants into the industry each solving local problems. Later as the industry becomes more standardized these firms begin to merge. This model helps to suggest why we see a power-law distribution of firm sizes in many industries. Industries that complete the phase transition become monopolies.

I particularly like this model because it helps to inform my thinking about what happens when one of the Porter’s barriers to a industry consolidationis eliminated.

The Structure and Function of Complex Networks

This is a wonderful paper. Your one stop shopping for all things network-science. Seventy five pages of overview! Dozens of pages of bibliography! Enjoy!

1 Introduction
1.1 Types of Networks
1.2 Other Resources
1.3 Outline of the Review
2 Networks in the Real World
2.1 Social Networks
2.2 Information Networks
2.3 Technological Networks
2.4 Biological Networks
3 Properties of Networks
3.1 The Small-World Effect
3.2 Transitivity or Clustering
3.3 Degree Distributions
3.3.1 Scale-Free Networks
3.3.2 Maximum Degree
3.4 Network Resilience
3.5 Mixing Patterns
3.6 Degree Correlations
3.7 Community Structure
3.8 Network Navigation
3.9 Other Network Properties
4 Random Graphs
4.1 Poisson Random Graphs
4.2 Generalized Random Graphs
4.2.1 The Configuration Model
4.2.2 Example: Power-Law Degree Distribution
4.2.3 Directed Graphs
4.2.4 Bipartite Graphs
4.2.5 Degree Correlations
5 Exponential Random Graphs and Markov Graphs
6 The Small-World Model
6.1 Clustering Coefficient
6.2 Degree Distribution
6.3 Average Path Length
7 Models of Network Growth
7.1 Price

Power-law networks: Early Movers and The Advantages of the Old

In my last posting on power-laws (this posting) I illustrated a simple simulation. It grows a network by having each node connect to the network by randomly mimicking the connections made by so far in the network. That model’s important because it gives rise to power-law distributions in the connection wealth of individual nodes. Important because it under cuts the argument that the success of a node is based on it’s quality. It’s not a totally unreasonable model for what happens in markets where the supply chain relationships are very sticky (i.e. we don’t simulate yet any breaking of connections) and the new entrants select their supply chain associations based by modeling existing associations. Such markets aren’t that exceptional in the wake of Moore’s law and his friends.

In this posting I want to look at the advantage of being an early mover into such a market. Older nodes in such a networks tend to be richer, but how much more? The advantage is exponential because the advantages of early entry tend to multiple over time.

Older nodes grow wealth for two reasons. First since the game (the simulation if you prefer) lacks any means for a node to lose wealth the longer you play the greater you chance of getting randomly selected for new connections as the game proceeds. Each connections a node garners becomes an additional generator of luck in future rounds of the game. So connections caught early in the game keep returning value thru-out the game. Secondly the effect is multiplies. Secondly early players are situated in a less competitive game. They have a higher change in each round of winning.

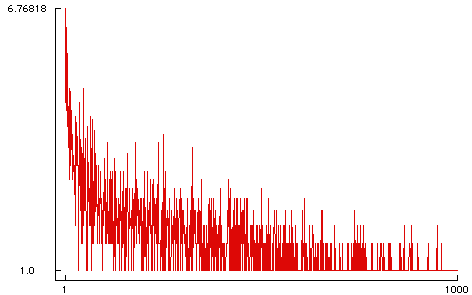
Both of these effects compound so that we can expect that the advantages of getting into the network early to be exponential. An in this graph showing which round a node is born in and how many links it manages to accumulate illustrates that. The horizontal axis is linear. The vertical axis is log base two; thus nodes with only two connections get a score of one.

AgeVSWealth.png

The roughly double expodential distribution of this advantage is clear; but since the fates (i.e. my random number generator) are indeed fickle getting on the bandwagon early doesn’t assure success. One round of the exponential is absorbed in the log vertical scale while the other can be seen if you visualize a fitted line to that noisy data. As you can see, some of the early players gained no long term benefit. I often go to work for those companies.

This graph is only for one run of the simulation but other runs are similar. That graph ought to be a scatter plot, but my graphing tool only does line plots and I’m too lazy to bother to fix it at this point.

All this reminds me of a meeting many years ago where 30 or so very senior technologies sat in a room grilling the senior vice president of a famous desk top software company. The usual problem was a hand. The schedule was slipping, promises had been made, PR as embarrassed, and we had gathered to decide how draconian the cutting would be to get the damn product out.

The question: “Just how important is, time to market?”

The senior vice president allowed as in his experienced it had always appeared to very important, if not more important than all other aspects of the product. Some of us in the room found that to be a less than compelling answer.

He was right. I think we now know why. I’m a believer now!

It’s tended to make less enthusiastic for traditional enthusiasm for process, elegance, care and more enthusiastic for a bias-for-action and a generosity with options that might reveal new networks of oportunity.

Growing Powerlaw Graphs

I believe the earliest paper that outlines the process that gives rise to a power-law distribution is Herb Simon’s paper from the 1950s that explains that the distribution of words found in human language texts (pdf). He explained them by modeling the process of word selection in those texts by proposing that the next word is selected based on the popularity of the previous words that have been attached to the text.

Barbasi and Albert’s revisit this model (pdf) in the context of growing a network. Their model can be illustrated by this simple function that builds a graph. As we will see the resulting graph will exhibit a power-law distribution in the node connection counts.


    (defun make-pgraph (n)
      (loop
        with g = (make-initial-pgraph n)
        finally (return g)
        for i from 1 below n
        as node1 = (find-prefered-node g)
        as node2 = (find-prefered-node g)
        do (add-node g node1 node2)))

This function grows a graph where each node adds two edges to the network. The function proceeds by creating an initial node, who’s two edges are self connected. It then proceeds to add the remaining N-1 nodes with two edges connected to two nodes, node1 and node2. We select which node to connect to via find-prefered-node.

All the debates about what gives rise to power-law distributions arise from arguments about the behavior of the find-prefered-node function. Here’s the one used here. It randomly picks one of the existing edges and then randomly selects the node at one end of that edge or the other.


    (defmethod find-prefered-node ((g pgraph))
      (let ((e (svref (edges g) (random (edge-count g)))))
        (if (eq 0 (random 2))
          (left-node e)
          (right-node e))))

Here is a graph showing the wealth distribution of the nodes in five graphs grown by this code. Wealth is measured by the number of connections a node manages to aggregate.

fewPowerLaw.png

I don’t see much merit in that function that guides the preferential attachment.

More code below the fold.

Continue reading

Powerlaw Puzzle

Joi Ito takes a stab at getting his head around what he thinks about the power-law puzzle. Dave Winer comments that he can’t think about the issue because he’s decided he doesn’t like the messenger’s credentials; the messenger in this case being Clay.

The power-law puzzle: We carefully designed a set of networks with the expectation that they would be highly egalitarian, we carefully avoided distribution bottlenecks, we were careful to commoditized the middleman; i.e. end-to-end networks. Much to our surprise when you look at the statistics of the communities that emerge on top of these platforms what you discover is power-law distributions. I.e. distributions of wealth that are frightenly analagous of the worst periods of human history.

For example, Dave Winer thought he was giving everybody their own radio broadcast station when he named his product Radio. Surprisingly the outcome was a lot of radio stations; but only a very small handful captured the vast majority of the listeners. Rather than a peer to peer outcome we got a centralized broadcast outcome.

The same story is true about web servers. We gave everybody the ablity to setup a web server at very low cost. Hundreds of millions took up the opportunity. Today the traffic distributions have settled into a extremely severe power-law curve.

The designers didn’t see this comming. Those same designers need to understand what happen. They might want to consider adding some additional design principles to the next round of systems.

Sticky connections and lousy information are the two things give rise to a power-law distribution.

Lousy information: is the eye of the beholder. Vendors and sellers rarely agree. Newcommers to a network rarely have the right skills to evaluate their choices. Popularity of existing nodes is a poor proxy for real information about what to connect to.

Sticky, sometimes called loyality, is what limits the ablity for a late entrant to displace an early entrant. It’s what gives the wealth time to adapt. Yahoo had to be asleep at the wheel for a very very long time to allow google to even have a chance at displacing them and inspite of that it hasn’t happened. Microsoft could fumble the GUI ball for a decade and still Apple couldn’t displace them.

Joi Ito run at this puzzle is to suggest that the power-law syndrome maybe a useful amplifier for good ideas. That’s true, but only if the system tempers the above two tendencies and if the platform where ideas reside is egalitarian. None of those three is true. Ideas thrive, in a power-law sense, if they spread fast, if they are sticky, and if they can manage to leverage the powerful gatekeepers in the knowledge networks. Those knowledge networks might be the blogsphere, FCC guarded communication networks, the elite acedemic journal networks, or your community’s social network – but you need to get past one of them.

There does appear to be another scenario where good ideas can leverage the power-law to aid their survival. That’s by creating a new network, a new platform. Which remindes me of the old cliche about startups these either go public or get acquired by Microsoft.

That new platforms is another way to work around the powerlaw puzzle in a sense is what Joi is getting at when he writes: “All disruptive technologies and innovations break power law curves by exhibiting exceptional fitness.”

I don’t see that it has anything to do with “exceptional fitness.” Creating a new landscape on which new enterprises rise up isn’t about fitting a niche; it’s about creating a new universe of niches. What grows first on newly exposed land is weeds. They are fit only in the sense that they spread fast. They persist if they manage to keep prevent other more interesting things from displacing them.
Question: Member models of networks

Lazy web query…

I’m looking for work about how members of a network build models of the network. In particular how do members of power-law distributed networks build their model of the network around them. For example if a member can sample the network randomly how long does it take for him to form an accurate model? What if his ablity to sample is limited the further he moves away from his home base in the network? My intuition says that the models built using either of these methods are amazingly poor; but I’m curious to read something that talks about this question more formally.

Bridge Collapse

bridge_collapse.jpg
Over the last few years it has become clear that if you begin with a homogenous substrate, like the Internet with it’s peer to peer architecture, what emerges is a network with a power-law distribution. I.e. there is an entirely natural mindless meritless mathematics that drives level playing fields toward terrible unequal outcomes.

In turn that makes it clear that thinking about the topology of the networks that a platform enable is the the key challenge facing designers in this generation.
That if we want to maintain some degree of equality as the world captures the benefits of one vast uniform platform for communications and trade we are going to have to mighty careful.

One extreme topological form in this design space is the bridge, or two sided network. For example eBay is a bridge between buyers and sellers. The village marketplace was the old example of this. Google, another example, bridges between searchers to those that wish to be found. The yellow pages was the old example of that. Platform vendors, a final example, bridge from diverse hardware to diverse applications.

The power-law distributions emerge because some players in the network become hubs; and a few of these hubs become very very large. I suspect that the bridge topology is only one way that a hub can function – it’s a design that helps the hub manage both to scale and to remain durable. I yearn to see if there are others kinds hubs – for example is there one that is analagous to the train yard.

In anycase I was amused by this paragraph about this cool tool that visualizes social networks.

LJNet puts social networking on crack – but this might actually have some negative side effects. My primary concern is worsening the potential social side-effects of ‘bridge-collapsing’ – allowing my friends to connect to other friends of mine without going through me as a bridge, a moderator, a contextualizer, etc can have some unpleasant side effects. Thus I’m considering a password-protected version of the LJNet system that only allows users to see their own networks, and to anonymize the 2nd degree friend nodes so that if I see that my friend has another friend with many interests in common with me, I’ll have to ask my friend to meet this person. Of course this wouldn’t be fool-proof, but this is my other concern before releasing it publicly.

Most people think the middleman is a somewhat dubious role; i.e. the whole problem of agency. But, what about the risks of “bridge collapse?”