Category Archives: power-laws and networks

Team forming in power-law contests

The frightening aspect of these power-law distribution is how destructive to equality they are. If you are engaged in a game who’s over arching process tends to create these skew’d distribution your and your love ones are very unlikely to go home a winner. For example in the other day’s distribution of open source licenses 81% of the projects have been awarded to the top two licenses.

But notice this! Games with a inequitable distribution of winners creates powerful incentives to form teams. Power-law games encourage group forming! A fascinating point since group forming seems to be a particularly good way to temper the severity of the inequality in these systems.

This posting on the power-law distribution in Oscar winning movies triggered that realization. The paper shows a powerful bandwagon effect around the various entertainment awards. Once a few dozen Oscars climb on the bandwagon of your film the rest are extremely likely to follow. For example the film Titanic captured huge numbers of awards one year. These award systems are interesting – they have lots and lots of prizes. For all I know there is an award for best costume designed for a fish.

So why would games like this encourage group forming? We know that common cause is the foundation of making durable groups. We know that teams in games have an obvious common cause – winning. Notice that if your game is like the Oscars then that bandwagon is the prize. The individual Oscars are only points.

Fascinating. Put your self in the shoes of our fish-wrap designer. Admit it, you desire an Oscar. If you can win an Oscar your set for life! Today you have two options. Should you go work on that absolutely marvelous art film “Hamlet the Haddock” or should you go work on Titanic? Oh, did I mention your children need shoes? Given the nature of the game and the imaginary box I just put you in you don’t really have any choice. Dump your vision boy, go work on Titanic! Your fish wrap master piece doesn’t stand a chance against the bandwagon Titanic.

Now I have a very bad attitude about contests. One winner many losers hardly sounds like a good design pattern, at least not for the players. So it’s a little disturbing to see that if your embedded in a game with power-law generating processes there are powerful arguments that direct you toward joining teams. Your best option is to sublimate your individuality and begin to form groups.
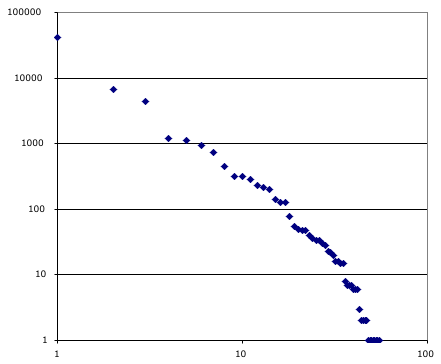
Open Source License Diversity

The chart at right has a dot for each open source license used by a project at source forge. Note this is projects, not installed base. I am not aware of good data for installed base. A typical power-law distribution.

All the usual forces are in play that would lead toward that. Preferential attachment for example means that licensing choice is can be modeled as nothing more than mimicry of the current license distribution. Then there is the multiplicative process where new projects evolve out of the substrate of old projects, tending to bring along their own licenses. Finally there is a certain amount of condensation where projects find it advantageous to adopt similar or identical licenses for functional reasons, e.g. the lawyering to figure out if license #12 is compatible with license #17 is enough to drive most reasonable men insane.

While those forces are far more determinative in driving this distribution than the functional distinctions between the licenses once the distribution emerges the distinctions between leading licenses become clear because that’s what you have to lawyer out. Like the distribution of human languages the installed base tends to be very hard to migrate; short of disruptive displacement of entire cultures.

It saddens me. Not that we have all this diversity, that’s to be expected. What saddens me is that we, the open source community, seem to get fixated on hair splitting about the distinctions between these licenses.

These licenses are a very high risk experiment. They are an attempt to find a means to create a durible vibrant commons. Something that will stand the test of time. Something that will be useful to everybody. While we have a lot of very smart people working on finding a solution to this problem we won’t know if we found it until much much latter in the game. In games with lots of risk and little certainty diversity is an very good thing.

It is a bad idea to put all our eggs in one basket. Oh sure, too much diversity would be a pain both in mounting out defenses well and in the cost of tedious lawyering about capability. But! I deeply wish we would all try a bit harder to respect and admire the choices that each license community is making as they run their experiment. People should back off on being some damn certain they have the future by the balls. I fully expect that over the years some of these models are going to turn out to be impossible to defend from those who would privatize the commons.

We are all on the same side here, right?

small vendors

I pushed the button on the microwave this morning and there was no breakfast in there. Breakfast was in the toaster. I feel the microwave let me down. Or possibly I’ve gotten the means confused with the end, or maybe it’s the distribution channel with the good’s distributed.

I love eBay or Google because of what they help me find. It’s easy to get confused about that. It’s not that they made those wonderful things and surely they deserve only the slightest credit for the pleasure I get from the things I find. While it’s not fair to blame this morning’s microwave for failing me it maybe fair to blame the intermediaries for similar failings.

I get a certain pleasure when I find a new rich appliance in the net that can feed me tasty things so look at some things I found recently and see if you can see the trick. Here you can buy 8-12 frogs legs. Here you can buy some sausages. You can get a thousand kinds of stamps over here. Need supplies for your revenge fantasies? Or maybe your ears are cold?

We need better ways to search, maybe the microwave wasn’t empty.

Tribal size

Ted’s post on Finding your Tribe reminds me that I’ve been meaning to see if I could hack something together to say about scale and groups. How many groups is a person typically a member of? If we ask the various social sciences -anthropology, sociology, economics, politics, demography, physiology – do they have answer for us? If we ask the various social movements what have they to say? Or ask similar questions of other metrics on these tribes? What of size of the tribe? What of the half life of membership; or the length of time required to join? What of the topology of overlapping groups?

I’m very suspicious of a kind of pop sociology that declares some number to be definitive. For example that there is an upper limit on the number of friends you can have; or the number of groups you can be a member of; or the set of skills you can accumulate. There are some very large tribes; American Catholic Democrats, or South American women soccer fans, or people who clip coupons. Notice all the tribes unmentioned in Ted’s posting: fathers, dwellers in wet places… It would be a real project to make even a reasonably good list of the groups one is a member of.

Modern life has brought about a shift in the overall statistics of group/tribal membership. Since people, on the whole, seem a happy lot, i suspect, should you ask the members of some insular tribe, or a modern city dweller you probably get about the same distribution of happiness. But the life the insular are living is totally different than that the urbane dweller can live. The richness of modern economics, the density of human habitation, the network of communications allows some people to engage with the world in surprising ways. Ways that are not just hard for the insular citizen to imagine they are actually impossible for him to experience. For him an upper physical reality created an upper bound on what was possible. In that situation the rules of thumb are self evident. When the upper bound evaporates the rules get harder grasp.

If the numbers suggest, which they do, that the group forming is scale free then we need to go back and ask each of those social sciences and movements what they wish make of that. If they wish to sing the praises of a particular scale, or disparage some other scale what should we make of that? The numbers certainly don’t care, they are the facts. Are the new ways of living displacing the old insular models? I think that’s obvious.

Baby name drift

I enjoyed this nice little paper on the changes over time in baby names. Drift as a mechanism for cultural change: an example from baby names.”.

They look at the census data on the top thousand baby names over the 20th century. Their goal is to see if they can fit a simple model of how the population picks names to that data. They drag out of the census data a number of interesting facts.

  • New names appear in top thousand, on average 2.3 names a year.
  • The rate of new names varies (they don’t correlate that with other demographic/economic trends).
  • New girl names appear 1.4 times the rate of boy names.
  • Both the rate and the variation have tended to increase as has, of course, the total population and a number of other measures.
  • The top thousand name a decreasing proportion of the population over the century. 91% at the beginning for both males and females. 86%/75% for mail/female at the end.
  • At the same time the slope of the distribution(s) hasn’t changed, instead the larger population has made the long tail much larger. (I’m not sure I entirely buy that.)

The fun the authors are having in the paper is to show how they can create a surprisingly simple simulated world that behaves in just this way.

How simple? Well they don’t need to include any number of things you might think deserve to be in a model of what’s going on here. While we all believe there are baby naming fads they assume that parents select names independent of each other’s choices. While we know that lots of parents name thier children after themselves or their grandparents they assume they don’t. While we know that James is much more likely to be invited in for an interview than Karim given identical resumes they assume that names have no functional value. In summary they assume that name choices are independent, not intergenerational transmitted, and are nonfunctional traits.

The model then simulates naming as a random process with two components. Names are drawn either from the pool of existing names in the prior generation or a small portion are random new names. If Ashley was popular in the last round then she is likely to be popular in the next, as she was in the 1990s From time to time a few new names pop up, as Ashley did in the 1950s. Exceptional roles of the dice can enable a name to make rapid moves in rank, as Ashley did in the second half of the century.

They are very pleased that their model fits the behavior of the data so well. It certainly fits the aggregate data well. For example they can get the variations in the slope of the distribution to behave very closely to what’s in the data. They don’t say anything explicit about the volatility of individual names, like the Ashley case. If this was the wealth distribution rather than baby names that would be a standard question to look into.

The final point is that this is a slightly different model of how to get a distribution like this. They say in passing that the rate of random names entering the population has a large effect on the slope of the distribution; but then leave it at that. I’ll need to look into that.

Meanwhile, the data on which all this is based appears to be sourced from here, so as you can see if you look the data is in ten year buckets, bummer.

Other is important.

This is fun! This Java app displays the ebb and flow of popularity for the top thousand first names. Names are distributed in a power law; so the top thousand are the elite names.

Notice how you don’t, glancing at this display, get any sense of how huge the space of names really is or how dominate the top few are. For example the display can only show the first 100 or so in it’s initially. Another example of how blind to the long tail we usually are.

I find it fascinating how many people I know who’s names do not appear at all on this display at all. I guess that’s a good sign. (See also.)

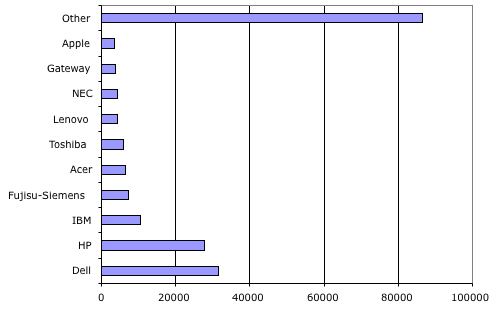
It’s extremely hard to visualize these power-laws populations. It would help a lot if this chart included a strata for all the names not broken out in detail.

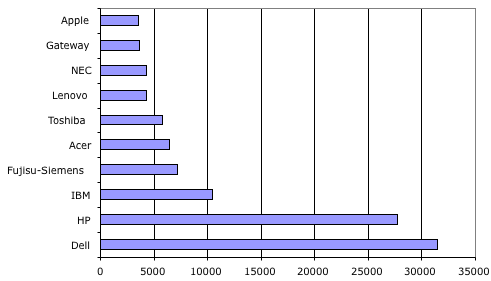
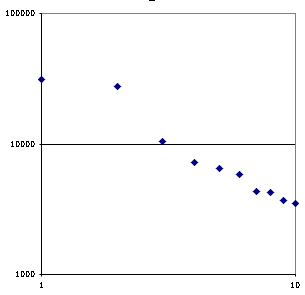
Here’s a good example of that problem. This table shows the top N vendors of personal computers along with the number of units they are estimated to have shipped. The log-log plot shows that this industry is, like most industries, power-law distributed (particularly if you gloss over the transitional situation around HP and Dell).

So that ought to make us suspect that there is a long tail of PC producers that aren’t shown in that data. How big is it? Well it’s approximately half the the industry.

Other is important!

When this data was recently released all the articles talked about the horse race between Dell and HP. But isn’t the actual horse race between these few firms and all the others? I wonder what the trends are for the long-tail category. Last year it was a few percentage points larger. I wonder why? Which players prefer a large other category? Could that be the real story behind IBM’s sale of it’s PC business; they prefer a large other in this a complementary business.

I wonder if anybody has looked at the trends in the first name data. Are we growing more or less diverse over the last century. (Update: Oh look a paper on the drift in baby names and it’s distribution (pdf))

Tagging, a look at a long tail.

I’m still enjoying using the del.icio.us tagging as a sample in the space of power-law things to look at more closely.

Let’s look at the long tail of one entry. Typically it’s hard to get a actual long tail onto a page. These are all the tags for http://scholar.google.com/ (see here). 623 unique tags.

I’ve sorted the list into alphabetical order give all tags, particularly those from the long tail, a more equal standing. You can draw your own conclusions; bearing in mind that one sample isn’t much.

!!!!, !research, #geeks, *education, *service, -unread, .en, .imported, 01r, 0_o, 1_research, a.big.fat.one, academe, academia, academic, academic_paper_search, academic_search, academico, academicresearch, academics, academy, aimee, amazing, anthropology, application, apps, article, articles, artigos, bib, bibliography, blog, blog-it, blog/research, blogmarks, boek, bookmarks, books, bored, busca, busca-web, business, care.in.tum.de, ccte, citation, citation*, citations, cite, college, computer, cool, cornell/wmc, corp:google, cs, daily, databanken, database, dev, digitallibraries, diku, dissertation, doc, documentation, e-library, e_reference, edi, edu, educacao, education, educational, eg1413, ego, encyclopedia, engine, engines, enma, escola, especializada, excathedra, excellent, facts, free, from/furl, geek, general, google, google-tools, googlescholar, googletags, handy, highered, history, ia, indexing, info, information, information_retrieval, informationretrieval, infoscience, inspiration, intellectual, interesting, internet, inthenews, ir, journal, journals, km, knowledge, lab, learn, learning, library, lilly, linklog, links, literary, literatur, literature, litterature, lookup, minutia, misc, moteurs.recherche, nachschlagen, neatokeen, nerdy, neuroscience, news, nitrogen, omfg, online-tools, open-access, opiskelu, paper, paper*, papers, papers.searchengine, papersearch, pc.tools, pesquisa, physics, popular, portal, publications, pubmed, pubs, readlater, recherche, ref, referance, reference, reference_tools, referenceandsearch, repositories, reseach, research, research-paper, research-tools, research/school, researchtools, resource, resources, review, rrrr, rsh, scholar, scholarly, scholarly_publications, scholarlycommunication, scholarship, school, science, sciencepaper, seach, search, search+engines, search-engine, search-engines, search.engine, search.engines, search.paper, search_engines, search_tool, searcheengine, searchengine, searchenginer, searchengines, searches, searching, searching.googletools, searching_and_saving, seo, services, services.internet, students, study, studyguide-and-strategy, stunning, suchen, suchmaschinen, sustaturako, system:unfiled, tech, technologies, technology, techy, temp, the-literature, theory, todo, tool, tool(s), tools, toread, tufts, undervisning, uni, university, url, usabilidad/buscadores, useful, util, utilities, utility, uva, via/ip, web, web-tools, web:tech, web_applications, web_search, webbyscience, weblog, webservice, webservices, webtools, whitepaper, whitepapers, work, working, wow, ws, zoekmachine

Power-law tagging – part 2

Click here for a more exacting illustration of the power-law distribution of tags for things posted at del.icio.us.

Two things to note. When you click thru to the page at del.icio.us that provides a summary of the postings for a given URL the tags show are a subset of the full set of tags used. The chart shows all the tags used.

Second notice that the model of these as power-law doesn’t fit once you include the tags used only once. I think that’s probably because those tags are often used by users to denote some very personal function. For example they might tag a page monday to indicate that they plan to return to this item next monday. But, that’s just a guess.

These lines are similar to the one you get if you plot the usage frequency of words in English or other languages. These lines appear to be slightly steeper, but not much. I’m still surprised how similar they are.

Making Links

By now we all have come to understand that links are a unit of currency. The number of inbound links you have, the number of customer accounts, the number of subscribers to your site’s feeds are all metrics that denote something about how successful your doing. In turn we know that links create graphs and graphs of links often have power-law distributions with amazing class distinctions betwix the parties in the graph. We know those class distinctions are not a consequence of the merit or value created by the links but instead of how fast the graph is grown or how the nodes merge as market share is rolled up thru mergers. So we know a lot about links as elements in the process of creating wealth. Every scheme for creating links will become the target of bad actors.

We also know that links play a role in the identity problem. That the more you know about a persons links the more accurate your model of him can be. We know that accurate models of users are fungible. A better handle on who the user is enables targeted advertising and more highly discriminated pricing. A better handle on who the user is enables transaction costs to be reduced. Single sign on, one-click purchasing, automated form filling are not the only examples of that.

It surprises me that we need to be reminded of this each time we encounter another effort to create a means to creating a large quantity of links.

This month’s contribution to the let me help establish a mess of links party is one-click-subscription. The puzzle in this case is how to lower the barriers to subscribing to a blog. Solving this problem requires moving three hard to move objects – all the blogs, all the readers, and sticking something in the middle between them. Both suggested solutions need to move all three; but they vary in where they put their emphasis. The blog hosts are probably the easiest of the three to move – they have an incentive to move and the market is already very concentrated.

One plan is the classic big server in the sky plan. Everybody rendezvous around the hub server. Requests to subscribe are posted to the hub. The user’s reader keeps it’s subscription set in synch with the hub. The business model suggested is a consortium organized by the common cause of a stick – fear of somebody else owning this hub – and a carrot – the bloom of increased linking it would encourage. Since early and fast movers will capture power-law elite rewards in such linking build outs there are some interesting drivers to build the consortium. Large existing players should find it advantageous to get on board. The principle problem with this plan is it’s a bit naive. A consortium of this kind is likely to become player in any number of similar hub problems, for example identity. This hub will have account relationship with everybody. It would know a lot about everybody’s interests. To say the least, that’s very hotly disputed territory. This plan has triggered more discussion than the following plan.

The second plan that’s been floated is to introduce into the middle a standard which blogs can adopt and readers can then leverage. This implies changing the behavior of most of the installed base of blog readers. The structure of that installed base is less easily shifted. The idea is to have the subscribe button return a document to the client’s browser (or blog aggregator/reader) which describes how to subscribe. Automation on the reader side can then respond to that information. This means introducing and driving the adoption of a new type of document, a new MIME type. It probably means installing a new bit of client software on everybody’s machines. The browser market leader would have some advantages in making this happen; and could there for very likely coopt any success in this plan to drive users to use his aggregator. But then that may only point out that the only reason we have a vibrant market of blog reading solutions is because the dominate browser has been dormant for a few years.

These are hard problems, and this is only one of many we currently face.

Tagging Powerlaw


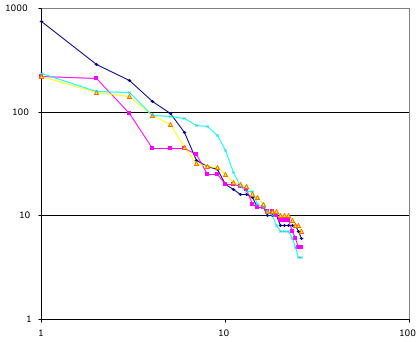
Following up on something Clay mentioned the following chart plots the distribution of tags for four popular URI at del.icio.us. Each line is the tags assigned to one URI. Each point is one tag, the vertical axis is how many times that tag was used to label that URI. The more popular tag for a URI is on the left; the least on the right. Note the power-law distributions.

I’m extremely surprised that the slopes are so similar. Of course a sample of four isn’t very large. If tags were drawn at random from the english language the slope would be slightly larger than -1. I’d assume that as the page becomes more focused the slope becomes more extreme. So that is, I guess, a hypothisis that if you find all the pages with more than 500 tags and extract for each of them a score, i.e. the negative of their slope. The high scoring ones are very focused while the less focused ones are more generic; i.e. scattered over the space of all things tag-able in english.

The audience of del.icio.us readers presumably is also critical in determining the slope. If they are all java programming, web site hacking, 20-30 year old geeks then that certainly imposes a high degree of focus. Or if you like message discipline.

Sadly I don’t see a trivial way to find a random set of pages with more that 500 tags.

Update: More here.