Monthly Archives: June 2002

Last name hit parade

This chart shows the population of individuals in the US sorted into buckets. One bucket for each last name. One dot for each bucket. Only the three thousand most popular names are shown.

last_name.gif

The axis on the left shows how popular a given name is, while the bottom axis shows what percentage of the population has that name. Both axis are log scales.

My last name, for example, is aproximately number 1000 on the last name hit parade. The bottom axis shows what percentage of the population enjoy that name, i.e. nearly .01 percent of the population.

This data comes from the US Census, say thank you! Try your name.

The striking thing about this chart is how smooth and straight it is (the choppy part at the upper left is due to how the data only had three digits after the decimal point). This pattern is known as Zipf’s Law and it appears in a lot of data involving systems with large interacting populations: words, cities, etc. etc ) where there is some ‘competitive advantage’ for the larger subpopulations.

Drive on the Right!

camel.jpg
When Afganistan tried driving on the right. The camels didn’t cooperate, so they switched back.

Some standards prescribe how to perform a solitary task. How to make plaster: mix the powder into the water never the other way around. The value adopting such standards is limited to improving the task at hand. Other standards that create efficiencies for the interaction of pairs or groups of people interest me. These are the rules that govern handshakes, roads, communication, meetings, trade, etc. The value in adopting these standards grows as more people you interact with adopt them – they have what is known as “Network Effect”.

Consider why people drive on the right hand side of the road (sadly that link is broken and the original essay at New Scientist has gone missing. Here is a substitute). This is a wonderful example. This “standard battle” unfolded over centuries.

On uncrowded roads you need no standard beyond avoiding the potholes. As crowding develops localities randomly pick something standard. They have a slight tendency to pick the “safer” standard: the drive on the left where your sword arm can defend you. Authorities, like the Pope, and events, like the crusades, help the standard to spread. The standard becomes tied to other issues, e.g. the upper class ride on the left while the lower classes walk on the right. “Know your place.” Come the revolution in France. “Liberte, Egalite, Fraternite!” Everybody drives on the right. This standards war then plays out thru Napoleon, Hitler, and the American century so that today the majority of the planet drives on the right. But still India’s billion people drive on the left since neither Napoleon nor Hitler conquered England.

I’m interested in how standards and network effects arise; how they spread; how they are disrupted. There are plenty of hints in this one story.

The Left Handshake

I’m interested in standards, the behaviors that groups adopt which on the one hand reduce the diversity while on the other add some efficiency.

Many standards are informal, possibly the majority. Consider the handshake. Why hold your hand vertically or offer the right hand? It is not hard to make up insta-theories for these choices.

lefthandshake.jpgThe boy scouts have a different standard handshake, the “Left Handshake”, which mirrors the standard handshake. If you are going to use a non-standard handshake people are going to react. “What’s up with that?”  And, secret handshakes always come with a story.

The Boy Scouts tell a delightful set of stories (imagine telling these in a hushed tone these around a campfire). “The chief of the opposing tribe appeared, flung down his shield and held out his left hand.” Or “The Ashanti Chief said to Colonel Baden-Powell: ‘No in my country the bravest of the brave shake with the left hand.’ So began the “left handshake” of the world-wide brotherhood of Scouts

How to get Rich

Five ways to get rich:

  • pick the right parents (inheritance),
  • pick the right spouse (marry well),
  • pick the right pocket (theft & conquest),
  • pick the right card (luck,serendipity, gambling), or
  • pick the right trade (craft, profession, industy).

This list was triggered by an essay by Brad DeLong on how the standards around inheritance have evolved thru time. I’d love to know which of these techniques explains what percentage of a given dollar of wealth.

Assuming wealth floats your boat…
Continue reading

Productive around the World

The following chart has one dot for every country on the planet. The vertical axis shows how productive a country’s citizens are. For example, people in Peru produce around $1000 per year. The countries are ordered from left to right, in rank order, so the most productive country Switzerland is first. The least is just off the graph on the right. The chart is a log log graph! There are lots of poor countries; some are frighteningly poor.

pp_gnp.jpg

These straight lines on log-log graphs of ranking in populations appear in lots of situations. For example in the distribution of wealth, the popularity of words in languages, or the sizes of cities. These go by different names; power-law, zipf’s law, Pareto’s law because it was noticed in different situations.

What do these things have in common?

The simple awnser is that this happens in systems where, over time, the rich get richer. If the system’s evolution gives some advantage to the better off then curves like this will settle out of the random processes that grow the system. Consider a city; if it’s got people those people will tend to breed and it’s population will grow; if there is something attractive about that crowd of people more people will be attracted; if we have few such positive reenforcements that and time is all we need.

Of course if these are systems created by human goverments then we somebody maybe tinkering with the rules. That can make the rich get richer faster or slower. I suspect that the top of that curve illustrates how the top few countries aren’t such separate countries when it comes to this measure productivity.

Where is the Internet?

This map shows where the Internet Routers are, and hence
where the Internet is.
router_density.jpg

Like the map of what is lite up at night it suffers from tendency to under represent thd dense areas and to over emphasis lightly populated areas with wealth enough to have Internet service brought to them.

People & Light

These two images show where people live, and who has sufficent wealth to turn the lights on at night. Respectively these show where to go if you like people, or if your afraid of the dark.

Each Dot denotes Ten Million People:

Were nighttime lighting is used:

On the population map notice Nigeria, Indonisia, the Ganges, China, the Mexican American border, the coast of Brazil, South Africa. On the map of night time lighting notice the lights along the Siberian Railroad, and odd way that the Brazillian coast line seems dark. Areas where the population is spread out and which have some money seem to be better lite – the American midwest is the most stricking example since nobody lives there. India is very thought provoking contrasted with Bangladesh.

Illustrations of this kind have a problem on both the low and the high end. The eye -or in the case of the night lights the camera – tends to give more credit to the lightly provisioned. On the high end overlapping dots can be extremely misleading; for example exactly how many 10 million person dots are piled up in the Bangladesh? Another interesting example of this is this large map showing the population around Boston, MA, USA with very small (a hundred people each) dots. Even with the small dots the map gets overwhelmed downtown and the bright red tends to make the rural areas seem more populated then they really are.

Thanks to Brian DeLong’s collection of graphs and illustrations found here: Semi-Daily Journal

Wealth & Democracy

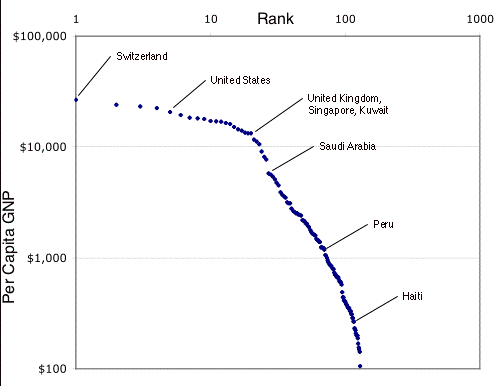
The top 1% own just about half of everything. That’s really hard to think about. Everywhere you look; half of that is owned by only 1% of the population. Cars, trees, radio, TV, bytes; half of all of it. Can that be good? Kevin Phillips new book talks about this in depth. The reviews are good, the interviews are interesting and I’ve been collecting links and interesting quotes from them:

Assorted reviews of Kevin Phillips’s book WEALTH AND DEMOCRACY: A Political History of the American Rich.

A review in New York Review of Books by Jeff Madrick. “the fabulous personal fortunes of the 1980s and 1990s now rival and in some ways even exceed the mythical fortunes of the Gilded Age.”

“Phillips then goes on to argue that such excesses of wealth and greed and inequity have helped bring down–or may even have been the chief cause in bringing down–virtually all flourishing great powers in the past”
Yale historian Paul Kennedy writing in the LA Times

Phillips writing in a
Q&A sidebar to that article: “Conservatives tried to make class conflict something to frown on in 1896 and 1932, but without great luck. The turning point came when the success of the New Deal greatly reduced the share of wealth and income going to the top 1%, and as democracy and a middle-class ethos carried into the 1950s and 1960s, “plutocracy” began to seem like an old threat that no longer existed. Now the concept of an economic “over-class” is as relevant again as it was in 1896.”

Bruce Reed’s review from Washington Montly “… a funny thing happened on the way to the class war: The rich won.”

From Princeton economist Paul Krugman’s editorial in the New York Times “an influential body of opinion has reacted to global warming and the emergence of an American plutocracy the same way: ‘It’s not true, it’s not true, it’s not true, nothing can be done about it.'”

Kevin Phillips, “Market Extremists Amok,” The American Prospect vol. 13 no. 13, July 15, 2002. Kevin sure can write a full scale rant. “Extreme politics, in this new form as in others before it, has a distinct regional home. As much as the ideological excesses of the left in the 1960s evoked Berkeley, and the militia groups on the right were a Rocky Mountain phenomenon, the market mania of the last two decades has centered on Texas — economic Lone Ranger country, where market fundamentalism and religious fundamentalism have joined to create a uniquely strident culture.”

Paul Magnusson’s review review in Business Week. “Phillips compares the U.S., post-September 11, to Holland in the early 1700s and Britain in the 20th century, when each nation, at the peak of its economic power, expended its energy and treasure in a burst of warfare.”

Phillips quoted from the transcript of Bill Moyers’ interview on PBS: “a dynasty is a dynasty is a dynasty and these problems are there, and this incredible amount of money is … is just staring this country’s historical role in the face ”

NPR interview (real audio) “a ten fold increase in wealth in seven years” for the top 400 in the nation; never before.

Audio interview (real audio) from Radio Nation. 47% of the nations wealth is in 1% of the population’s hands.

Amazon Editorial Reviews, Customer Reviews

Joe Conason’s review in

New York Observer
writes: “What makes Mr. Phillips’ analysis so radical is his insistence on examining the roots of the great fortunes’and revealing the state power that underwrote so many of them.”

Price compairson: addall and abebooks. The author’s web site for the book.

Interview on Minnesota public radio.

Chapter One appeared in the Denver Post.

Diane Rehm’s interview from WAMU in DC.

KCET – Life & Times Town Hall SpecialTranscript. “In 1981, the average of the ten highest compensated corporate executives was $3.45 million. In 1988, the average of the ten highest compensated was $22 million. In 2001, the average of the ten highest compensated was $155 million. You know, that’s a 45-fold increase.” or “Middle fifth, the average household cash income in the middle fifth, sort of your medium household, $31,700 in 1979, $32,600 in 1989, $33,200 in 1997. Now we got to the top one percent, $256,000 in 1979, $507,000 in 1989, $644,000 in 1997.”


Article
from LA times by Kevin Philips circa 2000. “In the 2000s, just as in the 1970s, the 1930s and the 1890s, a tough bear market and its aftermath could be what brings about an economic, governmental and regulatory overhaul. A serious stock-market decline always serves as a political as well as financial indicator. Brother bear–the Ursa Major of economic disillusionment–has been the power behind populist and progressive booms from William Jennings Bryan through Franklin D. Roosevelt.”

July 8th 2002 Article from The Nation Dynasties! by Kevin Phillips. “Only at first blush is there silliness to the idea of the United States–the nation of the Minutemen, John and Samuel Adams and Thomas Jefferson–becoming a hereditary economic aristocracy.”

Review by Scott London. ‘The growing ineffectiveness of American government is part of a larger “reversal of fortune” where political and economic influence has shifted from the grassroots of America to a new “guardian class” in Washington.’

Atlantic Monthly: A wordy dialog between James Fallows and Kevin Phillips.

Audio interview and call-in on The Connection, a radio program on NPR. “The top 10% own about 80% of the publicly traded stock.”

Kevin Phillip’s is one client of the Leigh Bureau. Here is his biography from their speaker’s catalog.