Category Archives: natural-world

Mushroom Update

This isn’t what I expected from the block of sawdust I got for christmas. I did expect to get shiitake mushrooms from the block and indeed I did. But instead of getting a flush of 6-12 mushrooms I got this one magnificent one. It appears that the other ones which got started all aborted as soon as this one announced he was in charge. He was very tasty.

Large Shiitake mush room on block of sawdust.

Now I let the block dry out for a few weeks and then see if can get another flush out of it.

4400 > 911

That is much better!

$ ioreg -p IODeviceTree -n battery -w0 | grep Bat
| | | "IOBatteryInfo" = ({"Capacity"=4400,"Amperage"=1200,"Current"=1861,"Voltage"=10878,"Flags"=4})

It’s only money. It’s around $10/month.

The Equality of Mother Nature’s Aches and Pains

Since writing my recent posting on the power-law distribution of the population of earth quakes I’ve been drawing making connections in my noodle between that and the distribution of income. The distribution of income is the first thing that drew my close attention to power-law distributions. The distribution of income reveals how various actors in the economy manage to capture shares of the product of that economy. The distribution is more or less equitable in this or that economic system; but it’s always a power-law with a very small handful capturing the vast majority of the income being produced.

The distribution of earthquakes displays how various actors, individual earthquakes, capture a proportion of the total energy created by Mother earth’s aches and pains. Out on the long tail pebbles bounce down hills. It’s difficult to get a feel for exactly how much energy is released out there. If we included such tiny events then the percentage of events labeled as earthquakes would be very slight. Let’s ignore that long tail.

You can get a feel for the energy distribution from the following chart. This is the same data as the last post, but this time we plot a running total of the total energy released by the population of the largest few thousand earthquakes of the year 2000. Starting from the smallest one we sum them up until we get to the biggest one. You can see that even in this small population the vast majority of the energy released is owned by a small percentage of the actors.

Energy released by the top 5000 quakes of 2000 accumulating from left to right.

The largest quake in 2000 was a magnitude 8. You can see it’s contribution to the total 2000 quake energy of that year in the vertical space between the last two points. That gap would be 32 times larger for a magnitude 9.

Looking at just the few thousand big earthquakes from just one year is like modeling the wealth distribution by studying suburban Americans.

Another way to see this is to look at the earthquakes (source: ftp) in December of 2004, i.e. last month. These two charts show those quakes; the first chart plots them all in serial order versus their magnitude. Notice two things. First there are two large quakes; the second one triggered the tsunami. The first about a week earlier was in the pacific south-east of Australia. Second, note the cluster of after shocks, i.e. the quakes of magnitude 5..6 toward the end of the month; following the magnitude 9 quake.

The earthquakes of dec 2004.

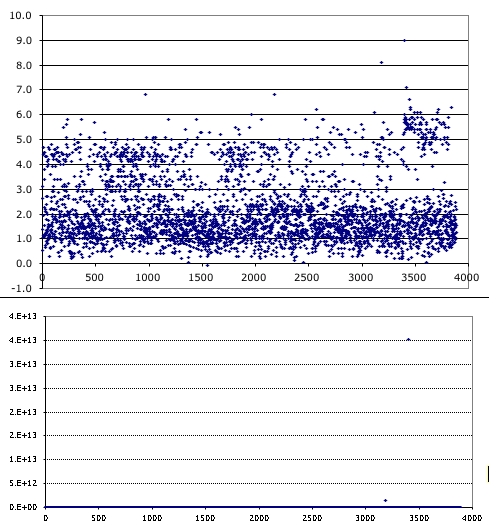
The second chart is identical to the first except it plots the energy released rather than the magnitude. On this chart only two quakes of nearly 4 thousand are notable, not even the aftershocks. None of the quakes in 2000 were this large. Makes me wonder what Mother nature is capable of.

Earthquake intensity is powerlaw distributed

Distribution of the top 5 thousand earthquakes in the year 2000.
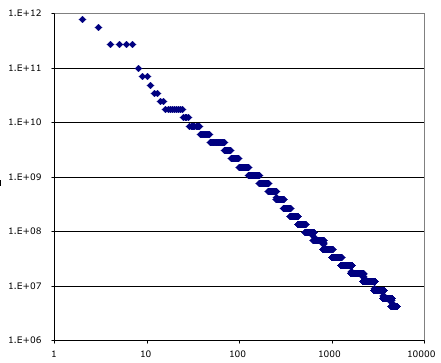
The chart on the right shows one point for each of the top five thouand earthquakes in the united states during the year 2000. The largest was a magnitude 8 and appears in the upper left and is plotted as rank one on the horizontal axis (well, it would if I hadn’t dropped the top point, so the second largest is in the upper left). The smaller the earth quake the larger it’s rank order on the horizontal. The vertical axis is the energy released by the earthquake, estimated from the reported magnitude. This grainy look of the plot is because the magnitude was reported using only two digits. The data is from here.

In conclusion the distribution of earth quake sizes is a power law. The social network of dirt?

Earthquake Trends

This breathless New York times op ed piece by the author of the interesting light popular science book on Krakatoa sent me off to see if I could get any hard facts about tends in planetary earthquakes.

The table given on this page enumerates so called major earthquake counts for the years 1967 thru 2001. If you fit a linear curve to that data the trend is slightly downward. Major earthquakes are those between 7 and 8 in magnitude. Large ones are called said to be great.

The table given on this page is for the years 2000 thru 2004, it includes the recent two great earthquakes. Each step up in magnitude denotes a factor of 32 in the amount of energy released. So if you weigh all those numbers by the energy involved you get a slight trend upward.

My conclusion from this very amateur attempt to get at the facts. No. The earth is not becoming more cranky; well at least not in the seismic aspect of it’s personality.

So save your worry for something else.

Bag of Wet Sawdust

Next up Shiitake mushrooms.

Bag of Wet Sawdust with Shiiake spawn

This is a bag of wet pasteurized sawdust. It’s in a plastic bag with a air filter so the bag can breath without becoming infected with something else. The Shiitake has grown all over the sawdust and you can see it’s forming something that looks like pop corn. To get it to fruit I’m supposed to put it in the fridge for 5 days, give it a bath, and then keep it at near attempt to keep it at 100% humidity. I’m thinking of building a high humidity box to keep it in.

They never come on time

This article by Richard Bernstein A Continent Watching Anxiously Over the Melting Pot that appears in the New York Times is just awful.

It fails to provide any demographic data. For example it doesn’t mention the problem of an aging population or the low birth rate. It fails to mention any transportation and regulatory changes than make population mixing so much easier. For example it doesn’t mention the effect of the European Union of cross national migration within the union. It fails to mention any of the forces – war, famine, etc. – that drive populations to flee their homelands.

Finally it casts a entirely false picture of America as a paradise of multiculturalism. That is so bogus! I live in Massachusetts, I gather we are a liberal kind place. We recently passed a law by popular referendum and over the objections of all experts to outlaw public school funding of curriculum in the student’s native language.

A friend of mine and I have a game we play that involves attempting to enumerate the well known cliches about ‘them’; i.e. those people who live in next valley, the other department, the next town, etc. For example their women are aggressive, but exotic and passionate. Their women are oppressed and submissive; but it’s an act. You won’t believe what they do to their children. Eat their young! Let them run wild! They do, of course, live for the moment – they don’t know how to defer short term pleasure for a long term benefit; like we do. You’d be surprised at what they wear. Clueless! Oh man. It’s a weak culture, yes, but that leads to a brutish power that you must both respect and fear. Rhythm, they do have rhythm. …

This article is a useless cartoon even than that.

What a waste of news print, bring on the fishes.

Oyster Mushroom Harvest

I may have let the Oyster Mushrooms ripen just a bit too much before harvesting them last night. You ought to pick them before they start to turn up along the edges and I notice in this picture they are almost there.

My son said they tasting like a nut with the texture of a mushroom. Really excellent.

The photo is a bit misleading about how much you get. You discard the small and tiny mushrooms (which are aborted) and the stems (which are tough).

Now to see if I can get another bloom out of my bag of wet straw.

Meanwhile I see that here you can buy a kit that enables you to grow three different colors of Oyster mushrooms in 15 roles of toilet paper. Boiling water is involved.