Category Archives: wealth

Thinking about Unemployment

Since the end of World War II each time the business cycle throws a lot of people out of work it has taken longer and longer for them get back into the work force.  Six months at the present time.

UEMPMEAN_Max_630_378

When the economic engine slows you get a recession.  It’s shocking how much labor is going underutilized right now.  This chart shows what percentage of the population is working.

EMRATIO_Max_630_378

These two charts aren’t looking at exactly the same thing.  The second chart is looking at the entire population.    The first chart is only looking at the slice of population which self identifies as participating in the labor market.

Incidentally and amazing is the big 20 year change (starting about 1975) was women entering the workforce so that another 7% of the population is now in the game.  But each business cycle pushes that along a bit more and the mix has changed, a lot.  Men have suffered 82% of the job losses so that now men and women are 50/50 in the workforce.  That’s a huge transformation of the society.  We now draw on the entire population, but the percentage of that population we employ is only up by a few percentage points.

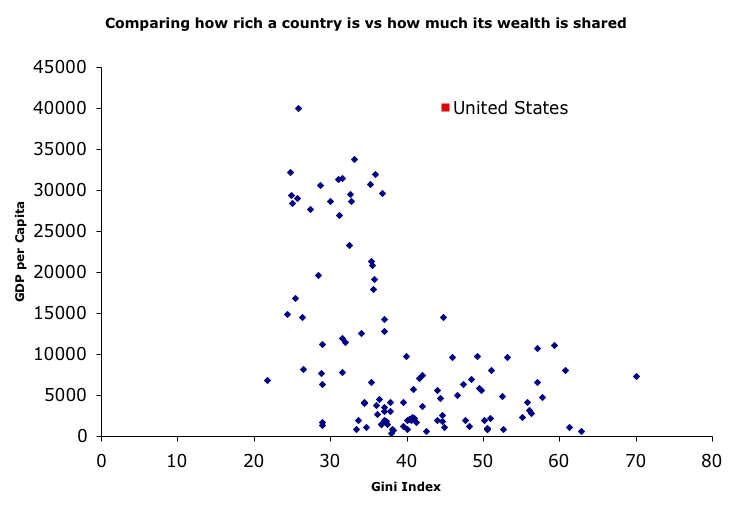
Not illustrated here is the huge transformation in the wealth distribution since the mid 70s.  The labor force has crappier jobs than they did 40 years ago.

Note how the recent fall off is the largest in the post World War II era.

There is something else interesting to note in the shape V shape of each recession.  The recession in the mid-50s is uniquely symmetric as is the one in the 1980s.  The mid 1970’s recession tossed people out of the workforce fast, and the recovery brought them back slowly.  The recession just after 2000 is frightening.  How’s that for something to worry about!

You can make your own charts like this here.

How to Screw the Poor

I suspect a lot of people believe that their state has a progressive tax structure.    That belief is wrong.    The well-off do not pay a larger percentage of their income and wealth than do the poor.  There are a very few exceptions, Delaware for example – at least in 2002.  Here’s what it really looks like.

Here for example is my state.

That shows how the mix of taxes effect things.  In Massachusetts it’s the sales tax that really does the damage.  The mix of taxes that implement this lovely situation for the parasitic well-off varys from state to state.  New Hampshire manages to be extremely regressive; using a different mix.

If you want to screw the poor then here some hints:

  • Avoid an income tax
  • If you have to have an income tax be sure it’s flat. (that’s what we do in Massachusetts)
  • Adopt a sales tax and some excise taxes
  • Use property taxes
  • Exclude capital gains from income
  • Use tax credits to counteract progressive taxes; say on federal taxes or certain property taxes
  • Be sure your sales/excise tax includes groceries, smokes, beer, and gas
  • Don’t index to inflation if forced into tax brackets, exemptions, or earned income payments
  • Empower local governments to raise funds using regressive means

No doubt there are much more creative schemes for assuring your tax system screws the poor.  I certainly can think of quite a few without much effort.  This posting is based entirely on the original edition of what is currently  this report, from www.itepnet.org; you can quickly find your own state here.

This is Washington state, which makes me wonder how those Microsoft and other high tech winners feel about this.

Overdue Homework

We have known about these charts for a while now; i.e. there is a sharp difference between how the economy changes under Democratic v.s. Republican presidents.  The economists have apparently made no real progress on explaining why.

Note how the cartoon Republican, i.e. the cigar smoking plutocrat, apparently votes against his interests.

GDP/Capita v.s. Inequality

Interesting chart (By way of some nice ranting by Dr. Traven.):
gdpcapitavsgini.png

I didn’t click around enough to see the data sources.  I presume that’s Japan up there on the left.  I’d not seen this before, so I’m suspicious.  Also, given how hard it is to pull a meaningful average out of a highly skewed distribution, like the wealth distribution, I’m always a bit uncertain what to make of a concept like GDP per capita.  For example, there are huge number of people in the US who make less than 10K/year.

If this was all you knew, and you want’d to raise GDP you’d start by addressing inequality.

Two Groups: rich and poor

This is an interesting post on income inequality across the nation’s states. What it adds to his prior posting is a brief synopsis of Jamie Galbraith’s model of what’s going on for the folks at both ends of the spectrum. I find it notable that both groups live on a raft.

The rich raft is the stock market – as the market rises and falls so do they. This says two things to me. One is that the rich are not easily distinguishable from firms for the purpose of modeling, i.e. that distribution of firm size and the distribution of individual wealth are probably the same. But more importantly, as a group, the rich have common cause in creating economic conditions that are, in short form, whatever is good for the stock market.

The poor live on a raft of social programs: the social security, food stamps, the earned income credit, and in the poor states the federal minimum wage. That should create common cause across that vast group to support state policies to improve and maintain those programs.

What I find notable is that in both cases the common cause of the two groups is about the nature of how the state engages with the market as a complementary actor. That again is the model exposed by the voteview work on legislative voting patterns. E.g. that the economic left/right axis practically one to one with the small/large economic actors.  Those on the left looking to provide complements for the small actors and those on the right striving to aid the large ones.

Income Trends, by State

This chart is so cool, that I can’t resist in-lining it directly; I hope it’s creator doesn’t mine. The states are sorted poor to wealthy, vertical scale is log of constant dollars. The upper lines are the median income of the top 10% while the lower lines are the bottom 10%. Horizontally shows 40 years. If the lines grow closer together, as they do in some of the poor states, income inequality is declining. Contrast that to some of the wealthier states. Note that there are a number of reasons arising from the highly skew’d distributions involved that make this chart a poor lens for viewing the data. For example, most of the population lives in just the few largest states (51% in the top 9) and most of the income is actually captured the top 1%.
income_trends_by_state.png

Click thru to the original posting for some additional charts that play with this data set.

Daddy’s rich and momma’s good looking…

From a press release

For example, low-income households, or those at the 10th percentile of the income distribution, spend approximately $8,900 per year per child, while high-income families, or those at the 90th percentile, spend $50,000 per child.

I find that hard to believe.  Where do people in the bottom 10% find $9K/child/year?  According to this report from the BLS the top of the bottom 10% make $163/week (“Usual weekly earnings of wage and salary workers, by upper limits of … deciles …”); though I have my doubts about the correctness of just multiplying that by 52 that’s $8,476 per year.  Maybe that number includes the transfer payments for what ever actually reaches the child via food stamps and public education. For comparison that BLS report leads one to conclude that $59,228 is the 90% annual income.  These are 1999 dollars, and salaried workers.  Of course the real explosive growth in the income distribution happens after the 90% level.

Professional Income Distribution

This deserves highlighting.  According to this chart lawyers salaries split sharply after they leave school.  Some of them are paid a king’s ransom while other’s are paid quite pedestrian salaries.  I suspect this is true for most highly educated people.

Larry Katz was recently quoted as stating that “Over the past 20 years things have been very good for highest-end abstract skills”.  In so far as that is conventional wisdom it allows the inteligencia to distance them selves from the falling income of the majority of the population.  It creates the illusion that top few percent, who have captured all the income growth implicit in the rising GDP, are their class brothers.  For many well educated people, as that chart shows, that is delusional.

Foreclosure Tracking

The RealtyTrac web site shows real estate foreclosure data for the US. It’s thought provoking to look at places your familiar with thru this somewhat specialized lens. What you want to do here is get to their maps quickly. To do that you:

  • enter a zipcode
  • select a house at random
  • on that house’s abbreviated listing page click on the interactive map button

Then browse around the neighborhood you’ve selected. When you want to look at another neighborhood, start over. Be sure to take a look at good and bad neighborhoods, places your friends and relatives live, and at places you’ve lived over the years. I really hadn’t appreciated how there some seemingly pleasant neighborhoods where it appears that one out of 20 homes are owned by the bank.