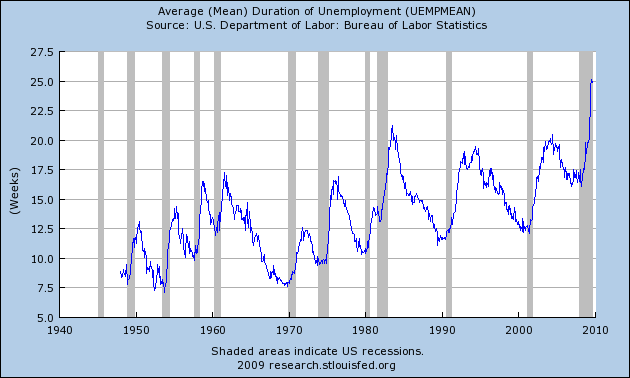
Since the end of World War II each time the business cycle throws a lot of people out of work it has taken longer and longer for them get back into the work force. Six months at the present time.

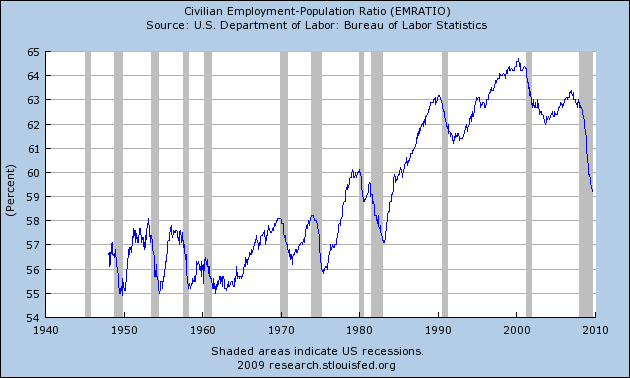
When the economic engine slows you get a recession. It’s shocking how much labor is going underutilized right now. This chart shows what percentage of the population is working.

These two charts aren’t looking at exactly the same thing. The second chart is looking at the entire population. The first chart is only looking at the slice of population which self identifies as participating in the labor market.
Incidentally and amazing is the big 20 year change (starting about 1975) was women entering the workforce so that another 7% of the population is now in the game. But each business cycle pushes that along a bit more and the mix has changed, a lot. Men have suffered 82% of the job losses so that now men and women are 50/50 in the workforce. That’s a huge transformation of the society. We now draw on the entire population, but the percentage of that population we employ is only up by a few percentage points.
Not illustrated here is the huge transformation in the wealth distribution since the mid 70s. The labor force has crappier jobs than they did 40 years ago.
Note how the recent fall off is the largest in the post World War II era.
There is something else interesting to note in the shape V shape of each recession. The recession in the mid-50s is uniquely symmetric as is the one in the 1980s. The mid 1970’s recession tossed people out of the workforce fast, and the recovery brought them back slowly. The recession just after 2000 is frightening. How’s that for something to worry about!
You can make your own charts like this here.
Interesting chart http://www.calculatedriskblog.com/2009/09/when-will-unemployment-rate-hit-10.html and discussion about the how people return to the labor market as they begin to percieve there are actually jobs to be found.