Category Archives: power-laws and networks

powerlaw in data structure pointers

The second data set I encountered with power-law behavior was while attempting to improve the performance of a huge software system, circa 1979. But I haven’t managed to collect an example of that kind for my collection so far.

Meanwhile this example shows power-law distributions in the inter-object references for in core data structures for a range of programs.

Back in the day when I’d read articles about GC algorithum design I never saw these graphs. Odd, don’t you think, designing a GC algorithm with out a model of this distribution?

via Rainer Wasserfuhr via his del.icio.us tagging.

P2P Reputation and Social Stratification

The nice thing about P2P content distribution systems is how they lower the barriers to entry for content producers. When things are working then the cost of distributing content to N consumers drops for the producer from N to 1, and the cost for the consumers rises from 1 to 2 (see here). In theory this enables content production to move much further down the long tail. It empowers the smallest players.

The design of these systems is a beautiful example of the design issues around a collaborative system. The consumers need to collaborate. If the total contributions of the consumers don’t amount to 2N then things fall apart. I’m finding it interesting to kick the tires on this problem. You can design systems to temper the freeloading by having the consumers accumulate a reputation. You can base the reputation on reports provided by other consumers. So if A provides content to B, then B can add to A’s reputation as a good actor in the system. If peer to peer exchanges happen in largely random patterns then A’s reputation will be assembled from a diffuse set of partners; making it harder to forge.

I assume it’s possible to design such a scheme. One that would allow peers in the system to know the contribution level of their partners with a reasonable degree of confidence. I haven’t looked very hard. I assume there are some papers on designing such diffuse reputation systems.

Ok, so I take it as a given that I can design a system where the participation demands a uniformity of contribution. But wait, I don’t want that! Look at the real world. Systems in the real world have multiple actors contributing to their total energy; and the distribution of their contributions is usually highly skewed. If the real world is that way, then is it a good idea to design P2P systems that effectively outlaw that distribution? What consequences would follow from that?

One thing’s clear. If you enforced uniformity you’d get class stratification. Participants of similar reputations would tend to flock together.

I’m reading a book about Common Interest Developments, i.e. the semi-walled garden highly homogenous communities created by developers. Their enthusiasts buy into a utopian fantasy. One who’s “overvalued idea” is the maintenance of property values. Other values tend to be displaced.

If we force uniformity of contribution into the architecture of P2P system, then that becomes it’s overvalued idea. Getting all fixated on the prevention of freeloading displaces other values? Why does the real world not work that way.

The delicate trick in getting the P2P reputation system may well be finding ways to encourage a diversity of participants. A means that it doesn’t lead to stratification, with that stratification and progressively tightening regulation of each group’s wall and internal norms. Very interesting tangle of problems.
Rifles and Shotguns

Jargon makes you special. Biologists call it R-selected v.s. K-selected, and I see that investors call them shotgun and rifle strategies (“happiness is a warm gun”), and I’ve called it weeds and tubers. I’m surprised though that I’d not made the connection before that these are like two sides of the power-law curve. One edge spending it’s energies on a quantity of connections and the other in the quality of the connection.

Are there really investment houses that are run on an R-selected model. Scattering as numerous investment seeds as the Norway maple in my back yard? Of course an investment house is different from a maple tree. The investor hopes to capture a disproportional share of the value created by it’s offspring. The a maple tree is only striving to reproduce it’s self in the next generation.

It’s obvious there are businesses who’s customer relationships are analogous to a R-selected strategy. It’s a subset of those companies with millions of customers. Not of all of these are actually structured to execute on an R-selected strategy. It’s one thing to have a million relationships, to scatter a million seeds, to draw a huge sample. It’s another thing to be setup to capture value from the few that grow large.

A bank might manage this. If they can avoid losing customers that grow large.

Developer network based platform companies manage this. Scattering a lot of low cost options into their developer community and then capturing value by selling the platform to the resulting success stories. Works if the developer splices the platform deep into his DNA, locking him in.

Chasing the Tail


I like this posting at Chris Anderson’s site. It’s some slides. They are good, but I want to pile-on a bit.

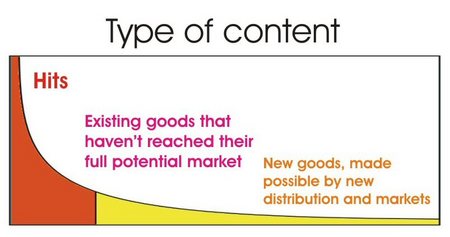
These slides all follow the same pattern, exemplified by this first one on products. They are the rows in a three column table.

The still bother’s me that Chris’s curve doesn’t particularly look like a power-law, it doesn’t cling to the axis. Gives the viewer a misleading impression about the middle class, it rarely captures as much of the energy in these these systems than it really does. It remindes me of the way politicians always pander to the middle-class. People seem to like to think they are in that class.

These slides all follow the same pattern, exemplified by this first one on products. They are the rows in a three column table. Here are the rows in Chris’ table.

Elite Middle Tail
Content Hits Existing Goods that haven’t reached their full potential market New goods, made possible by new distribution and markets
Incentives $$$ Reputation (leading to $) Expression
Status Pros Marketing/moonlighting Amateurs
IP Protection Copyright No Copyright Creative Commons

If we were talking about another power-law distribution we would find very different entries in the three columns. Study the distribution of wealth and you get a row with entries like: upper-class, middle-class, and the poor. Chris decided early to avoid some of these tar pits. Still, he as touched the tar baby. It will be interesting to see what he does with the issue of globalization.

I thought it would be fun to add more rows.

Elite Middle Tail
Wealth Upperclass Middle Class Poor
Nations G-7 Third World
Weather Hurricanes/Tornados Storms Zephyrs
Animals Birds, Reptiles, Mammals Insects Bacteria, Viruses
Settlements Cities Suburbs Towns, Villages, Rural
Vocabulary ? ? ?
Baby Names ? ? ?
Matter Solid Liquid Gas & Vacum
Firms Hubs, Markets, Platforms Classic Firms Small Business
Labor Politics? Capital Unions Worker
Standards

Tail Light Chasing, Installed Base Migration Industry Consortium Bottom Up
Religion world religion Denominations nondenominational, and private faith

These tables could use some more columns. Chris, for example, is interested in how shifting distribution channels are changing how the finite available attention is distibuted across the content. I’m interested in how businesses emerge that act like drift net fisherman raking the ocean of small players for value; and in turn how that effects the ecology. I suspect we are all interested in how the elite manage, capture, and horde their power.

Currency Exchange Hub

My theory is that exchange standards create networks and those networks exhibit power-law distributions. How skewed that is depends on principally on the regulatory framework around the exchange standard. Currency systems are a fine example of a exchange standard. There have always been numerous ‘currency substitutes;’ for example in the US we have coins, checks, credit cards, etc, etc. (see “war in my wallet“).

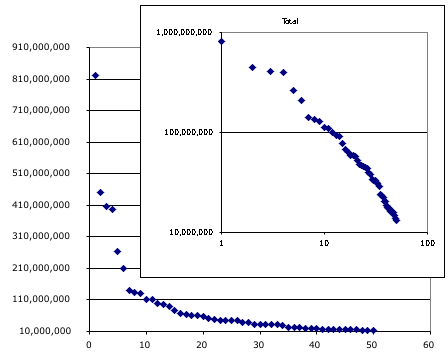
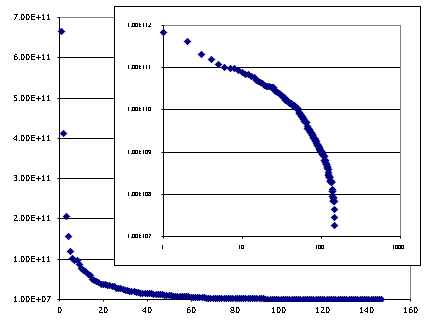
The check clearing system has a number of clearing houses. One of these is NACHA, an automated clearing house. Today’s chart shows the total transactions received by the top 50 financial institutions (pdf) connected to NACHA. This top 50 account for more than 90% of the traffic thru the exchange, and the top five account for more than 50%.

Banking is an interesting case because in the US we were very suspicious of banks so we regulated them to assure they were plentiful and small. But we seem to have gotten over that. For example interstate banks are recent development. Banking is rapidly condensing.


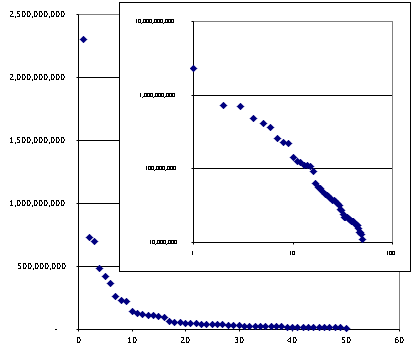
There is one point for each financial institution. The total transactions received on the vertical axis. The horizontal axis is the institution’s rank. One graph is linear. The smaller one is log-log there the line’s slope is -1.133.

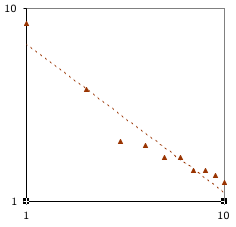
Here is the analogous chart for the institutions that originated the transactions; the slope of the line on log-log graph -1.397. Originators is more condensed.

Amazon Sales Rank -> Copies Sold

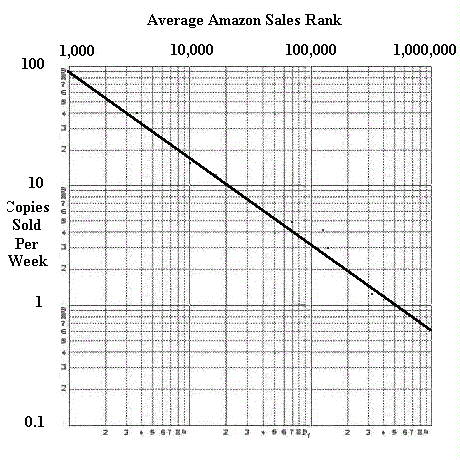
This is an attempt to estimate the number of copies sold of a book per week given it’s sales rank at Amazon, including the ever popular power law like graph. This reminds me of the cattleman who I once heard complaining on the radio about how he found it very obnoxious that city folk would ask him how many head of cattle he owned. “Why that’s just like asking how much I’m worth!”

Distribution of Foreign Exchange

Just another one for the collection…

This chart has one dot for each nation’s reserves of foreign exchange & gold. Even more skew’d a distribution than a power-law. Two other charts to consider. productivity, and Population v.s. Income.

The top handful on the chart are Japan, China, Taiwan, South Korea, Hong Kong, India, Germany, United States, Russia, France, Switzerland. Half the total reserves are held by the first 5, (Japan … India) or .3% of the nations, 80% of the reserves are held by the top 24 or 18% of the nations.