Category Archives: power-laws and networks

Flooding the Network

Cities are a geographic solution to the matching problem. Want to find a spouse, a model train caboose, a slide rule, a bar were they play music but not too loud, huitlacoche? At the same time cities aggregate webs of links that last over time. These networks of links sustain the urban residents and attract the rural. Economically vibrant cities like Silicon Valley or New York furiously generate new links. They build on top of the deep complex mesh of existing links. Economically weak and declining cities sputter along creating a fewer new linkages while their underlying networks are hoarded, decay, or depart.

The term social capital was introduced a few decades back in an attempt to give a name to some of that. The original idea of social capital was that you could sum up the value of a person’s connections if you sum up the capital equipment they had access to thru those connections. For example if I can borrow a hammer from my neighbor that’s part of my social capital. If I can borrow the company’s trunk when moving my apartment then that too is part of my social capital. If the boss will lend me his plane in crisis that part of it too.

Events that make and break links add and subtract from the net worth of your social capital. While you may lose a lot of capital worth when your house burns down you can lose a lot more when you move between cities, exit a club, switch proffessions, graduate from college.

There is a picture in today’s paper that show how people in the Astrodome have put up huge signs in an attempt to find other people in their social network. It says they ring a bell each time one link is reconnected. It boggles the mind to imagine what’s involved in re-stitching the social web of an entire city. How would I ever reconnect with the butcher that makes my sausages?

The demand to recreate these connections is one of the reasons why we will rebuild something around New Orleans. The desire to reclaim the social capital is extremely strong. It will work in tandem with the necessities of the physical capital. New Orleans is a distribution bottleneck for a whole range of goods. Distribution bottlenecks are very analogous to cities; a web of supply mets a web of demand and flows thru them like the food flows thru Paris.

One feature of New Orleans economy is how capital intensive it’s distribution flows are. It’s not like New York, Boston, or Silicon Valley where the goods that are flowing are practically weightless. The oil, grain, cement, automobiles that flow thru New Orleans depend of extremely expensive installations. Consider Henry Hub where the price of natural gas futures is fixed; 15 natural gas pipelines that reach out across the entire nation and a sea of storage tanks. Or consider the refineries any one of which would take Billions of dollars to reproduce. Or the oil terminal where one pipeline carries 20% of the US oil ashore. These distribution networks are very hard to move. Moving Howard’s Hub would require rerouting all those major pipelines.

The nodes and links in both the social and the physical networks range across various key metrics. Their value for example. My neighbor’s hammer is less valuable than my employer’s truck. Their resistance to breaking. Moving a pipeline is harder than changing where a shipping container goes.

When the hurricane comes it strips all the leaves from the trees; when the flood comes the weakest links are dissolved. But these are the vast majority of the links; and so that it always the greatest loss. It is very hard to imagine that those billions of dollars we are spending on relief and rebuilding will be focused on regenerate those. Yesterday I read about the engineer asked about the environmental effect of pumping out the city and he said; we have higher priorities right now. New Orleans has always been a city with a severely skewed wealth distribution. This is only going to make is worse.
Site v.s. Situation

Most excellent article in Slate about New Orleans.

…The river system’s inexorable downstream current swept cotton, grain, sugar, and an array of other commodities to New Orleans’ door. Because of the region’s geography and topography, many 19th-century observers believed that God-working through nature, His favorite medium-would see to it that anyone shrewd enough to build and live in New Orleans would be made rich.

… But it also brought water, wind, and pathogens, elements of a fickle environment that in the past as now turned cruelly chaotic.

Geographers refer to this as the difference between a city’s “situation”-the advantages its location offers relative to other cities-and its “site”-the actual real estate it occupies. New Orleans has a near-perfect situation and an almost unimaginably bad site.

Curiously that is directly analogous to my model of Microsoft Windows.

Reverse Flash Flood


In the southwestern united states they warn you about flash floods in the canyons. Storms dump a few inches of water at someplace upstream and this water is then aggregated into a giant pulse of water that sweeps down thru the canyon your standing in, killing you. The sky is clear and there is very little warning, maybe just a slight increase in the flow before the flood passes thru.

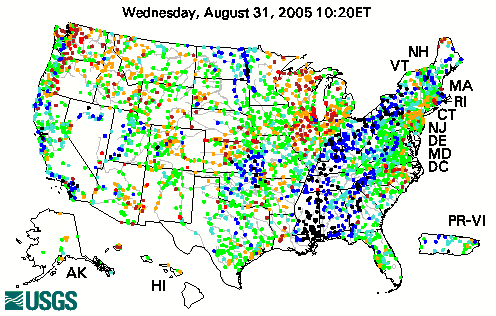
I’ve always been a fan of this realtime stream flow data network the government runs. It allows them to make accurate forecasts for the downstream flooding. The black dots on this chart show the gages pinned to their maxiumum. A number of gages aren’t reporting.

The tree like networks that draw the water out of river basins and down to the sea are made up of billions of links. Each segement of the stream another link. These networks are powerlaw distributed, the mighty rivers at their roots the hubs of thier distribution systems.

On Monday morning I filled the cars with gas, topping them up to capture the last of the gas at last weeks prices. I was actually surprised that none of the gas stations had raised their prices. Gas on the wholesale market in New York was already up and I assumed that station owners would reprice that huge expensive asset each morning. One guy I asked said “Later, we do it around midday.” Another guy said “The boss hasn’t come in yet.”

This morning we were awoken by a sound you don’t hear in the summer. The oil truck was delivering oil across the street. A few minutes ago another oil truck filled the tank of another neighbor. I don’t know if that my neighbor’s topping up, or if it’s their oil guys pushing oil out to their customers so they can, in turn, top up their tanks.

This is an interesting example of the long tail at work. The moment that supply shifts from abundant and dependable to scarce and volitile everybody along the entire distribution system changes their behavior. They address the volitility risk by adding reserves to their storage capacity, but they also shift capital into oil and gas because of the perception that their price will be higher in the future. I.e. it’s a good investment to top up my car’s gas tank or for my neighbors and their oil guy to top up their storage tanks.

This is a facinating example of the long tail at work. If the entire periphery of the distribution system tops up it’s as if the river basin suddenly starts running up hill. The calculations about risk and future values changes for each and every link in the entire distribution chain.

Ker. Ching. – using network effects to dominate tiny markets


In growing markets new buyers lack information to select the best vendor, the one that fits their needs best. In this absence of information they grasp at straws; other measures which they can understand. Proxies for quality. The simplest model for why you get highly skew’d distributions, like those seen in market share numbers, is to have new entrants link to whom ever already has a lot of links. Market share in one time period generates market share in the next; not just a little bit, but a lot! This is why early movers can have so strong an advantage. They can then create a brand – and a brand is nothing if not a proxy for doing the real work checking if a vendor fits your needs.

GapingVoid is yet another blog written by a consultant who’s attempting to puzzle out how the Internet is reshaping his craft. He’s a marketing consultant. For example he’s currently experimenting with liqouring up gatherings of bloggers to see if that rebounds to the benefit of one of his clients, a vineyard. One of his success stories is English Cut, a high end tailor – $4K/suit. This posting muses about how successful that experiment has been. It’s kind of guilty gloating. He quotes an observer who notes how the English Cut has captured the hub for high end tailoring. It’s become the brand in high end tailoring. He also muses that this kind of tailoring isn’t a particularly scalable business; double your customers doubles your work. Which is trouble if you have to do it all by hand yourself.

All this is very mysterious. Clearly blogs inject more information into the market. Since lack of data aids early movers blogs would appear to tempering early the mover advantage of the mindless linking to what ever is popular. But just as clearly blogs don’t do that. One reason they don’t: the blog gets caught up in it’s own early mover effect. Observe any class of blogs and you’ll find few hubs that arrived late to the game. Worse yet the late arriving hubs often appear to be explained by their association with older or larger hub. That skewed distribution means that if your a winner then it’s Ker. Ching. and if your not then your a dead body.

This seems to it implies that the globalization implicit in blogging is very damaging for small players. If the market doesn’t expand tremendously then blogging is just another tool for consolidating an industry. That blogging, in this case, is just another distribution channel – a distribution channel of marcom. Distribution channels define the links, The links lead to the skewed distribution. The skewed distribution creates a pile of dead bodies. Traditionally some industries, like high-end tailoring, because they don’t scale the participants don’t threaten each other and the members can be quite collegial. Enter the internet where the network effects rule and that collegiality at risk. It’s winner take all.

Vectors

Evolution of Infectious DiseasePaul Ewald’s book is a rant against conventional wisdom. It opens with a flat out denial: parasites and diseases do not tend to evolve toward more benign relationships with their hosts. The conventional wisdom is based a series of just so stories, an optomism that would do Pangloss proud and a Kansas school board model of evolution.

This stuff has consequences. It’s actionable. Bacterial, viruses, etc. evolve very quickly. When we change their environment they are almost always find ways to leverage those changes. Decisions about public health can leverage that in positive ways. Or, they can blindly ignore it and creating horrible unintended consquences.

I read, rather than skimmed, the whole book because the stories are rich in analogies to the stories I’m most interested in: those about middlemen, platforms, and networks. For example mosquitos act as a intermediary for malaria. In this domain they are called the “vector.” Like the postal system, UPS, or the rail roads they provide transportation services. Understanding many of the stories in this book demands picking apart how how the infecious agent evolves in the face of pressure from both the distribution channel and the host. If the nature of one changes the bacteria (virus, tape worm, etc.) changes to strike a different balance.

There is a facinating insight here: severity of the disease is tied to the nature of the distribution channel. For example diseases which use mosquitos for as their vector, like malaria, are usually more severe than airborne diseases. A mosquito borne disease tends to be severe so it can immobilize it’s host and assure that the mosquito has an easy time feeding and when it does it’s meal contains carries the infection. If we can arrange for the patients to be moved into well screened houses where they can’t be reached by the mosquitos then this scheme falls apart. In which case it’s preferable for the affliction to evolve to keep their hosts mobile – i.e. a less severe varient of the disease emerges. This kind of modeling suggests why the common cold is relatively benign (it needs to keep the host mobile). It is very suggestive about why the trenches and field hospitals of the first world war may have generated the 1918 influensia epidemic; where the army provided continual supply of fresh hosts and mixed them intimately with those infected.

Key to many of the interesting scenarios around networks, standard, and businesses are the situations where the links are made between two different groups and these stories with the disease is the leveraging services of two distince parties seem quite analagous. A middleman, in a business context, covers his expenses by charging the parties on either side, usually differing amounts. So the dating service will charge men more than women while eBay will charge sellers while it advertises to buyers.

The same pattern happens here. Malaria is reasonably benign from the point of view of the mosquito. Analagously the fraud around eBay, the broken hearts around dating services, the viruses on Windows, the spam in your mail box are all reasonably benign from the point of view the intermediaries.

Reading this book you begin to think that any time you see mixing between two classes of actors you need only look and you’ll find a parasite that’s discovered a way to play the middleman. The stories I found the most disturbing are the ones where caretakers become the vector. There is a disease of coconut palms that uses the machette’s of the plantation workers as it’s vector. That story has the horrible plot twist that there are two ethnic groups and only one of these group’s plantations were infected. It had nothing to do with how they ran the plantations, only that the disease agent was issolated because the two groups never exchanged machettes.

He believes, but doesn’t quite have the research to prove, that many of the horribly virilent diseases that have emerged in hospitals over the last few decades can be explained, and then controled, by using these ideas. That these deseases have evolved so they can use the doctors and nurses as vectors and the patients as hosts. The key to pulling that off is to evolve to be benign in the vector and virilent in the host. Any difference between patient and caretaker is an opportunity waiting for a mutation to leverage. Newborns are particularly rich in these differences. So are patients taking antibiotics because they have suppressed their entire spectrum of bacteria. There is an ugly story about an outbreak of murderous diarrhea in Chicago. All cases were traced back to 27 hospitals; but how did they spread between the hospitals?

Escaping the Long Tail – an infectious disease example

Imagine the plight of the poor bacterium. It want’s to be a big player, but it’s just one of a huge number of bacterium and it’s tough climbing up the rankings. First off it needs to get past that huge barrier to entry, the stomach. Very occationally it manages that. But now it discovers that the ecology it’s entered, the intestine, is crowded with vast numbers of natives. These guys aren’t very welcoming. Worst yet they are well adapted to local market conditions. Early adopters I suspect. What to do?

Evolution of Infectious DiseaseCholera’s solution to this problem is to: appeal to the Government, manipulate the platform vendor, trick the host body. It delivers a swift kick to the digestive track wall, via a toxin, and the host body flushes the entire digestive track. This empties out the ecology of all those pesky competitors. The end result is that Cholera’s ranking isn’t so far down the tail anymore.

I wonder if there is an example of this pattern in business. The direct analogy would require a platform vendor who regularly deals with bad actors by flushing out the entire ecology. Sort of like the police clearing out a marketplace when ever fights start breaking out among some of the market participants. Democratic governments with regular elections might be an example. A varient of the classic problem of regulatory capture. Which then reminds me of the phrase “A new broom sweeps clean.”

In point of fact Cholera’s not particularly interested in capturing the host’s regulatory system. The goal is actually to achieve the maxiumum reproduction and then to spread successfully thru it’s distribution vector; i.e. the water supply.

Some of the management cult memes exhibit that pattern. They aren’t particularly focused on enhancing the operations of the firm but instead infect the minds of the employees who then leave carrying the memes to other firms. Their success is then enhanced by triggering the exodus of existing employees.

Escape from the Long Tail

Ian Holsman wonders about what causes things to rise up out of the long tail. That, certainly is the question! It’s the question the activist asks; how do I get my movement to move? It’s the question standards maker asks, how do I get folks to climb on my bandwagon? It’s the question the entrepeur asks, how do I launch my product, generate my buzz. It’s the question asked of the infectious desease in the jungle, will you become the next plague? It’s the question asked by the investor, when is this idea about to sweep thru the crowd becoming the conventional wisdom? It’s the question that every open source project asks, what keeps the community together and moving forward? All of these domains have answers to the question. It’s amazingly tedious reading your way thru it all!

This question seems to illuminate one of my problems with Chris Anderson’s The Long Tail. He noticed that some business models have managed to dodge this question. They avoid answering the question by betting not on an idea but instead on a vast portfolio of ideas. These businesses are not in the long tail; they are leveraging it. They solve some problem, distribution say, that is widespread. That’s a good thing, and solving it creates advantages for members of the long tail. That creation of advantage energizes them, makes them more mobile, helps them get out of the jungle and into the cities where they can spread more casually.

What Chris is calling the long tail business models are like whales. They feed by straining the vast watery long tail drawing a calories off the occationally lumpy bits So it’s not surprising that Chris frames the Ian’s question in terms of filtering. That’s how the large firms see it. But that isn’t how the small entity sees it.

The whales that Chris first noticed were disruptive about distribution channel; i.e. Amazon, Netflix, etc. can have seemingly infinite shelf space. The giant box stores like Home Depot are another example of this kind of monster. Google, for example, a whale of the filtering kind. What I think of as the “findablity” problem. The Yellow-pages was a precursor of that kind of beast.

The commercial answer to Ian’s question? Buy ad sense ads?

No, later.

So, are the end to end principle (pdf) and worse is better really the exact same idea? Both are kind of negative in tone. Both have MIT appearing as a character in their stories.

End to end isn’t a paper about the risks of agency, or middlement, but those issues are clearly in the background. Worse is better is more conscous of the social engineering that is going on as the designer makes choices about the shape of his system. Neither is particularly clear that the designer is crafting an option space, a search paridigm, a platform, or a standard. To my mind both have become deeply assocated, over time, with our culture’s romatic notions about the little guy, the rural, the entrepenur. Ideas that are currently appear in the role of “long tail.”

Loyality is very skew’d

Chris Anderson points out an interesting power point presentation from a company called DVD stations ptt/pdf Their business is DVD rental kiosks. The kiosks print DVDs on demand and have really fast connection back to the mother ship. Like all attacks on a distribution channel the upside comes from unlocking value that couldn’t get thru the channel beforehand. In this case the long tail of content. There are some nice charts showing how much value there is out there. One curiousity, they have a little budge in their revenue for movies that are around 9-10 years old, what’s up with that?

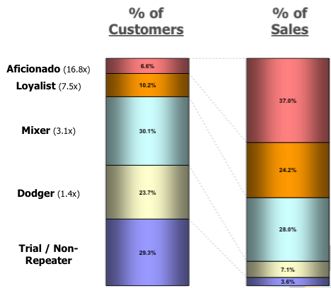
I was interested in two charts. The first one shows a portion of their sales pipeline, it shows that a few customers account for a large chunk of their revenue. You gotta love the labels marketing people put on the folks in various stages of their pipeline.

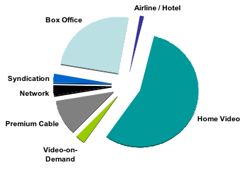
The second chart shows which channels distribute thru and how much revenue comes out of each. Since I don’t watch cable TV I was surprised how much is premium cable and video-on-demand. This is pie is of course a slice of yet larger pies, i.e. the entertainment pie. In the future the big slice is going to be neighborhood puppet theaters – you heard it here first!

Of course I suspect that both these pie charts are just power-law curves, but ironically they don’t display that. They want to be an elite. For example, in the customer catagory space that leads to inevitably into pricing discussions and then into the new dark ages of DRM content.

Powerlaw of War

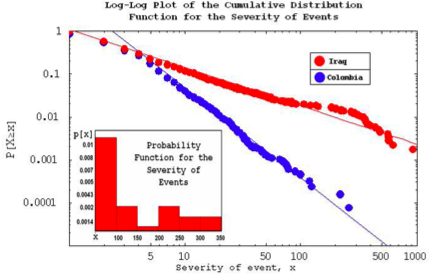
A bleak but facinating example of a power-law distribution. The first drawing shows one data set from events in Iraq along with another for events in Columbia.

The vertical is how awful the event was. Iraqi conflict is less severely skewed than the Columbian. Adopting the terminology of wealth distribution you’d say the Iraqi conflict is more equitably distributed.

The second chart is a rare catch. It’s plotting alpha, i.e. the slope of the power-law over time.

The article via kolmstead and the powerlaw tag at del.icio.us.

The frequency-intensity distribution of fatalities in “old wars”, 1816-1980, is a power-law with exponent 1.80. Global terrorist attacks, 1968-present, also follow a power-law with exponent 1.71 for G7 countries and 2.5 for non-G7 countries. Here we analyze two ongoing, high-profile wars on opposite sides of the globe – Colombia and Iraq. Our analysis uses our own unique dataset for killings and injuries in Colombia, plus publicly available data for civilians killed in Iraq. We show strong evidence for power-law behavior within each war. Despite substantial differences in contexts and data coverage, the power-law coefficients for both wars are tending toward 2.5, which is a value characteristic of non-G7 terrorism as opposed to old wars. We propose a plausible yet analytically-solvable model of modern insurgent warfare, which can explain these observations.