Category Archives: power-laws and networks

Organizational Competition

dancing.jpg

One idea that appears in passing in Fukuyama’s book on Trust is that the Chinese communists recognized that they were in competition with the large extended families (often 100+ people) all tied together via the strong family loyalities that are a prime virtue of Confucism. So they labored long and hard to displace those family organizational ties with organizations and loyalities that were under the thumb of the party.

I found that an interesting idea to generalize a little. Americans at one time had a huge diversity of organizational forms: churchs, men’s clubs, sewing circles, local schools, labor unions, proffesional societies, parent-teacher organizations, YMCA, settlement houses, chambers of commerce, baseball teams, folk dancing clubs, etc. etc. These days I think you could argue that there is a stern competitive force arising out of the near religous enthusiasm for market based approachs that is laboring to compete against all of that.

If your involved in most any of the above people tend to project it into a commercial/economic framework and then ask about cash flow, marketing, affinity programs, etc. etc. It’s pretty destructive questions.

Meanwhile these small overlapping organizational forms give the substance to the tail of the power-law distribution of organizations. They help to lower the magnitude of the exponent.

Link Slut

kids.jpg

Brad DeLong makes a plea for more sleeping around! Excellent memetic engineering Brad! I want to be one of the first to help get this meme around. My earlier attempt at a similar meme The Ologarchy of Bloggers was such a looser compaired to “Link Slut”!

Now let’s see. For this sleeping around thing to work you absolutely have to link to a blog that’s less popular than yours. Otherwise – your just serving sleeping with the man!

Now at technorati I see I have 8 incomming links. So I need to find a 7 or less to link to… humm. Amazingly blog.com has only 18, but still he’s the oppressor. So no link for him! But happy day it does suggest early to market isn’t everything.

Ah, http://www.gnik.com/ isn’t even in technorati – amazing. Go, now. Camp out there!.

Road to inequality

I am very slowly reading and enjoying Charles Tilly’s Durable Inequality. It is a diffucult, very academic, read. He is facinating, though.

At one point he writes: “I claim that an account of how transactions clump into social ties, social ties concatenate into networks, and existing networks constrain solutions to organizational problems clarifies the the creation, maintenance, and change of categorical inequality.”

Golly a single sentence goes a long way toward both explaining power-law distributions and as an added bonus providing a basis for a very functional theory how and why organizations emerge and persist. Something subtlely different than Coarse.

Name your children well

Power-law distributions, like the one seen in names, seem to arise from preferential attachment. For example parents tend to name their children with names that are already popular. I think we can assume that parents prefer to give names to thier children that will serve them well; I certainly did. A thought provoking example of this can be seen reflected in this report in the New York Times on this study. Resumes submitted with ‘black’ names were significantly less likely to be invited in for an interview than resumes with ‘white’ names.

Rain into a papercup

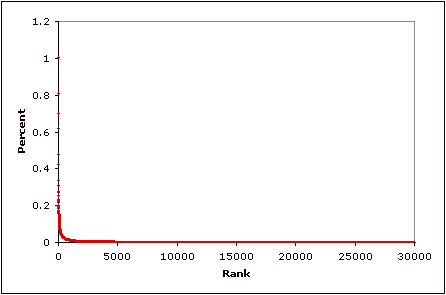
I’ve been meaning to get an example graph of the following
kind up for a while now. This illustrates how a power-law
distribution appears when plotted on the more familiar
linear scale rather than a log-log scale.

This graph shows the same data that’s discussed on in a
prior posting. Each of the 30 thousand red dots on
on this graph represents a particular last name. The
vertical axis shows how popular that name is while the
horizontal axis shows the rank for that name. For
example the most popular name is Smith. Just over
one percent of the population is named smith. Followed
by Johnson at .8%, Williams at .7%, Jones at .62%.

last_name_lcurve.gif

Distributions like this are very counter intuitive. It’s
as if it rained and you went out in the back yard and all
the rain had fallen into papercup. But wealth, income, words, web traffic, earthquakes, city sizes, etc. etc. are
all distributed this way.

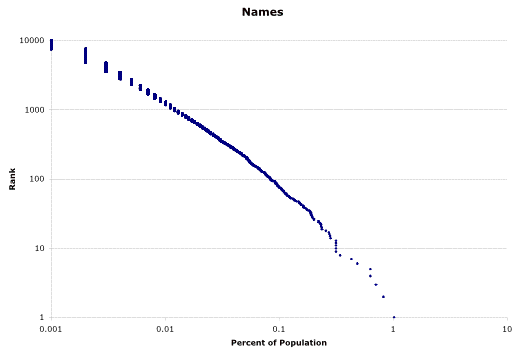
Here’s that same data plotted on a log-log graph (as shown in a prior posting):

last_name.gif

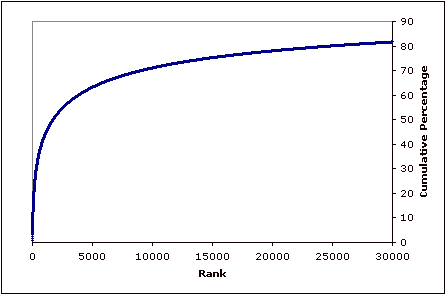
While finally here is the same data plotted showing the cumulative percentages. If every name was equally popular then this graph would be a straight line.

last_name_cum.gif

High Tech Power Law

Brad DeLong offers a graph showing Spending on IT v.s. the Price of IT offerings”. (IT -> Information Technologies) What’s not surprising is that as IT offerings become cheaper then folks buy more of it. Of course what caught my notice is this is a log-log graph and that straight line the symptom of a power-law process at work.

If we buy into the model that power-laws emerge from the connection making patterns in growing graphs graphs then it’s plausable that what is shown here is that as the price falls the number of connections in the graph rise. That suggests there is a lot more leverage in lowering the price of IT products than one’s natural intuition might suggest. That in turn may have some interesting implications about open systems (open-source, open-standards, etc). There is no question in my mind
that much of the vitality of open-source arises out of lowering the barriers to
enabling it’s binding into the various systems that engineers are building.

There seems to be something here worth saying about module boundries and phase transitions but I can’t quite figure out what it is.

That is absolutely not the demand curve encountered in econ 101 courses. That demand curve makes venture capitalists salivate! It let’s them expect to make outragous returns on their investments.

If you poke a hole thru the existing fabric of module (or standards) boundries your reward is a huge burst of new connection making. The resulting build out is a nice opportunity to make money; or better yet – from a rent seeking point of view – maybe you can capture over a long period a toll on the flow over the connections created.

The Oligarchy of Bloggers

Blogs are another system where we see power-law distributions. If we treat each blog as a node in a directed graph then the inter-blog linking can be used to rank each blog. A nieve observer might assume the best blogs have the most incomming links; confusing links with quality. A leading blog is more likely to garner additional links as the set of blogs increases. This is a beautiful example of “The rich get richer”. A world where the assumption that quality=links=wealth drives a positive feedback loop.

Consider a simple model. At any given instant in time a blog can collect a new link for one of two reasons – Quality or Findablity. A) Quality: It’s a really marvalous blog that people want to read. B) Findablity: It is a blog with lots of links so vast crowds of people find and randomly some link to it. If a million people find your lousy blog you’ll garner a lot of links. If a handful of people find your marvalous blog only a handful can link to it.

The challenge for the blogging community is to architect things to that people have an easier time finding the blogs that they personally find to be great. For example the authors of news aggregators should be aware that when they bundle in highly ranked blogs they are accelerating this rich get richer effect.

This is really the heart of the RSS design problem!

What other stuff could we do?

Could we build more rankings, for example rankings that are more topical. For example it it really useless that when browsing one of those blog ecology graphs I keep ending up at the same handful of blogs. Power-law distributed graphs have that kind of “black-hole effect”. All the tools need to compensate for that! What would it mean to create some kind of graduated income tax for blog linking?

The folks playing with graphs of the blog community ecology need to get some attributed quality rating scheme going. If I link to 10 other blogs I should be empowered to broadcast what I know. For example I know this link goes to a guy that’s funny, and that one to a site that’s reputable, and this one to a leading proffesional of kind foo.

Maybe news aggregatoring tool vendors provide schemes that measure the “use value” of a the blog on the other end of a link. How often did the link get followed? It could then publish that – for what it’s worth as one ranking attribute of the link.

Then there are freshness issues. I use NetNewsWire for an aggregator. I have about 40 RSS feeds in there. Some are pretty solid, but alot come and go as I try out various blogs, see if they can hold my interest. I wish my aggregator helped me do that.

Google – will it work?

Google’s solution to the librarian’s problem – findablity – stands on the presumption that links create a valid proxy for quality. It works delightfully when the population manufacturing links validates that hope.

Google is great in all kinds of esoteric domains where thousands of enthusists and domain experts are laboring way stitching together the web.

It seems to fall down when the domains become less esoteric. For example it’s useless when commerce is has created a fog of links that effecively jam the algorithum – e.g. try “I feel lucky” for cheap long distance service. Conversly it breaks down when the topic gets sufficently esoteric that there too few people working on it to create enough links that google can see ’em – e.g. try “I feel lucky” for economic displacement. Most of history is in this “under linked” catagory; for example I’m a fan of the story telling school of economics from the 50s and 60s but almost none of that is on the web.

Which brings us to the question at hand; google is moving into news! (See Google News). Will the optomistic approximation links=quality work there? I think it’s going to be hard. The stuff is all fresh – so it won’t have gotten a lot of linking by proffesionals and enthusasts. There is a vast industry in place (i.e. PR and the news conglomerates) that labors furiously to jam the signal.

Of course optomisticly we can hope this raises the role that tools like blogs can play on the one hand and it might reanimate the job of the expert – the job the newspaper editor used to fufill.

I wonder if their ranking of articles is informed by their ranking of the newspaper that ran the article.

The model where quality=links is interestingly similar to so many other nieve models: quality=wealth, or quality=age, or quality=income, or quality=ancestors, quality=test_scores, quality=power, quality=certification. They are all a proxy. In a world of 10 billion attributes picking one or two certain to blind those that take them too seriously and lead to that great fear of conservatives and liberals alike unintended consequences.

Pricing Games & Network Effects

Network effects. By definition, the utility function of a product with network effect is dominated by a term that grows with the number of users of that product. For example a phone is more valuable than a intercom entirely because there are more users on the otherside of the telephone network than there are users on the other end of an intercom.

Products with network effect – it would appear – have the key aspect required to generate a power-law distribution, i.e. they link up more customers in proportion to how many customers they have already attracted. It is common to say that products with a strong network effect tend rapidly to a winner take all monopoly outcome, e.g. an extreme case of the power-law distribution.

If you are a dominate vendor in such a market differencial pricing is a critical part of your toolkit. To get (and maintain) the network effect of a large installed base you must serve users with a low willingness to pay (say residents of the third world) while conversely you want to harvest the high revenues of users who are less price sensitive (say residents of the first world).

Meanwhile you have another problem. Some users bring exceptionally high value to your network – for example in the phone system the presense of the police and fire department brings substantial value compared to the typical residencial user. Such high value members of the product network are said to complement the network. You may wish to bribe (where the price goes negative) complementary users to get the substantial value they bring into the network.

These same issues arise when attempting to get a standard adopted. The advocates of the standard, who may only desire that the network exist so they can get on with their core activities, may find it desirable to take actions to drive prices down to drive up adoption. For example contributors to the standard may find it advantagous to relinquish intelectual property rights in support of getting the standard more widely adopted.

This kind of discounting to drive adoption occurs in both large and small enterprises. With an important emerging standard we might see IP rights being relinquished to lower the barriers to wide adoption. At the other end of the scale you might see a local grocery story use discounting to bring customers into the store. In both cases the discounting serves to increase market share. Of course network effects are not the only reason to grab market share. For example, if you can capture a relationship with a customer you can often sell him more stuff. I.e. discounting may be used to capture a customer into a sticky relationship.

Of course there is always the risk of a bait and switch. A player might actively advocate the adoption of a standard. Then, he waits until the standard has achieved critical mass and a strong network effect. Finally, he proceeds to assert his IP rights – collecting a tax from the users.

In a similar scenario a vendor might sell his product at low price points to third world customers so he can reserve the option of charging them higher prices should their nations GDP grow sufficently. That’s a kind of ground cover strategy.