Search Frequencies/Person & A Public Service Announcement

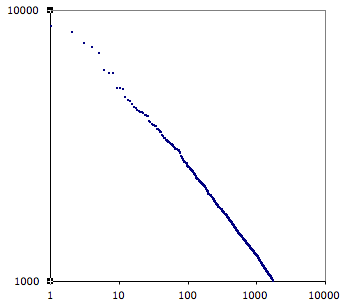
AOL recently released a huge sample of search engine queries. In a highly questionable move they tied these queries to reasonably anonomous user identifiers; for example we know that user known as #724 searched for “how to install a glue down floor”, as well as “carbol tunnel” etc. He did 366 searchs between March 1st and May 5 2006.

Unsuprisingly the distribution of search generators is power-law distributed. This is a log-log chart. Each dot on the chart represents one AOL users. The vertical axis is how many searches they did; for example the highest dot, aka user 2263543, did 8695 searches. This is only the most active 20 thousand users in this data set, the least active of whom did 313 searches. The complete data set has 657 thousand users, 57 thousand of whom only did one search.

Actually I dropped the most prolific searcher, user #71845, who made over a quarter million searchs; and totally messes up my nice straight line.

Today is national mental health day. I think the most disturbing thing I’ve noticed as I browse this data is the number of people searching for information on how to commit sucide. There are effective treatments for depression.

Crazy

I installed ubuntu on an G3 blueberry iMac, and it works ok.


bhyde@ubuntu:~$ set | wc -l
4251

Golly.

FYI – installing via the Live CD doesn’t work, while the alternative CD did – but that requires time and expertise.

Real Estate Map Porn

These heat maps of the price per square foot for real estate (in so far as they are accurate) are very cool. Cleveland appears to have very uniform prices (but that maybe dynamic range); while Chicago has very extreme ones.

This is nicely complemented by this very old example of the same idea: London in the 1890s, which is a, I believe, just about the beginning of this kind of thinking.

But really it’s impossible to get a sense of the scale of things.

Tar Baby

I don’t like my Governor, Mitt Romney. And I think people who use the word niggardly just because its linguistic roots happen to be independent of the word nigger are obnoxious insensitive pedants. That said, I’m sad to see that there are some members of the black community who feel the term tar-baby is offensive to their community. The folklore wherein the tar-baby appears is an excellent story full of wisdom. It would be a shame to lose the lessons it teaches. One of which just happens to be how the weak minority can bring down the clever and powerful.

Mast Year, Network Failure, and Information Cascades

Tree’s don’t get around much, but they still engage extremely syncrhronized behaviors. From time to time all the trees of a given species though out a region will decide to throw a party. These are known as mast years. In these years all the trees in the region will produce vastly more seeds than in other years. It’s an orgy! The distribution of seed production/year is highly skewed with the majority of seeds being produced in these mast years.

I’ve been thinking about power failures, in particularly electrical power failures. Random failures in the power grid pop up all the time, but with surprising regularity large swaths of the power grid fail. I suspect that if you had a plot of the # of customers-days of various failures you’d get a highly skew’d distribution. We know a fair amount of why these grid failures happen. The grid isn’t a grid, it’s a scalefree network. If it were more like a grid then it would be more robust; but a grid is expensive compaired to a scale free network. The grid failures arise because a random failure hits some reasonably key component and then the rest of the grid fails as the problem cascades thru the network.

For example last summer, or the summer before, we had a power grid failure across the megalopolis on the east coast of the North America. The network was running at capacity that hot day when something near Ohio failed. As the load shifted the safety triggers on other components decided that they should resign from the network – to protect themselves. Each resignation accelerated the cascade and soon a hundred million people were without power. I found that interesting at the time because it makes a link between the issues of pure go-it-alone self interested capitalism and the issues of collective good. We have been playing out a recent enthusiasm for handing public goods over to private actors here in the US. These private actors have trouble successfully coordinating the building of enough excess capacity and reliablity into their networks. As the network failures become more likely the individual actors, seeing that their capital equipment is more at risk, tend to shift their safety triggers down; or at least i presume they would.

This year we had a example that’s worse, in it’s way, of a power grid failure. The grid in Queen’s New York failed. This time it appears the the safety triggers were set too high. Again during record load a component failed; but this time as the failures cascaded other components stayed loyal to the network with the result that rather than resign they committed sucide. Which is way bad because to reboot the system they have to pull new cables to replace the ones that burnt out.

Both those models are, to be clear, entirely speculative. But I’d love to know if after the first failure the guys in Queens went around and readjusted thier safety triggers.

The mass years, presumably, are information cascades thru some communication channel the species members have stumbled upon. I bet that when they figure it out they will discover that larger groves of trees play a role in triggering a successfull cascade.

Trees, like other members of the ecology, are embedded in an web of inter-species relationships. Observers have noticed that the mass years throw quite a ripple thru that web.  The squirrels get fat when oaks have a mass year.  They have lots of offspring.  The orgy cascades. The population bubbles and the next year it starves. This  pattern is actually good for the oaks; who would like to get their seeds past those pests.  During the abundant year many seeds get past the squirrels. The following year every acorn is found by now desperate squirrels.  By the third year most of the squirrels have died and the oak can again get a lot of acorns past those pests.

I bet there are similar patterns in the supply chain web after each of these power failures. For example I bet there comes season a bit after a large grid failure when you can get a generator really cheap from a vendor who was fat and happy just a season ago.

Polarization and Paralysis

Here’s another interesting point from Polarized America.

When your designing your governance scheme one of the levers you can adjust is how much consensus is required before it’s possible to make major changes to the rules. For example here in the US it’s is very tedious to change the constitution. Another example is the Senate’s rules that make it impossible for a contentious issues to pass with a slim majority. There are lots and lots of these schemes; for example all the checks and balances built into the system.

So it’s no surprise that if the nation becomes polarized then the Congress becomes is paralyzed. That’s how the system was designed and it’s one of the patterns the authors of Polarized America illustrate that with data.

So then what happens? A few things. The two sides in the argument trash around looking for other means to achieve their goals. This model has something to say about the president’s repeated efforts (largely successful) to expand the power of the executive branch. This thrashing around attempting to find alternate ways get control of the government’s power is inherently dangerous because they skirt the boundaries of what is legal. The frustration of polarization creates an emotional climate where the political actors can self justify falling off the edge.

Because many of the programs that are designed to temper the concentration of wealth (i.e. programs that redistribute wealth) like the minimum wage, social services, education funding, health care funding, are not indexed to inflation this paralysis has the side effect of eroding their effect. Since this time around the primary poles of the division are about wealth that reinforces the polarization.

One notable thing about the models underlying Polarized America is the counter intuitive result that when you look at the actual votes in congress the social conservative dimension is a extremely weak predictor compared to the economic one. That’s counter intuitive because most of the rhetoric about American politics is about ethical and moral issues; e.g. stem cells, minor rights (race, gay, women), and the degree of separation between secular and religious institutions.

That too can be explained by this the realization that the architecture of our government means that a polarized you can’t make major changes.

The irony here is that the architecture is probably protecting the right from getting tossed out on its ear. The data is clear. The electorate has broad deep support for the redistribution programs that temper the corrosive effect of concentrated wealth. They also are an extremely tolerant bunch with little interest in the socal-right’s conservative agenda. The architecture has allowed the right to avoid the blame for eroding the redistribution schemes of economic liberals, and prevented them from the most socially conservative acts.