I’m dieting again [1, 2] So, here’s an R script to convert the log from the app I’m using to track my progress into a pretty picture.
f=list.files(path="~/Dropbox",pattern="Libra.*csv")[-1]
x=read.csv(f,sep=";",skip=3)
colnames(x)[1]="date"
x=x[1:2]
x$date=as.Date(x$date)
ggplot(data=x, aes(x=date, y=weight)) +
    geom_point(size=I(.8)) +
    geom_smooth(aes(group=1))+scale_x_date() +
    opts(axis.title.x=theme_blank())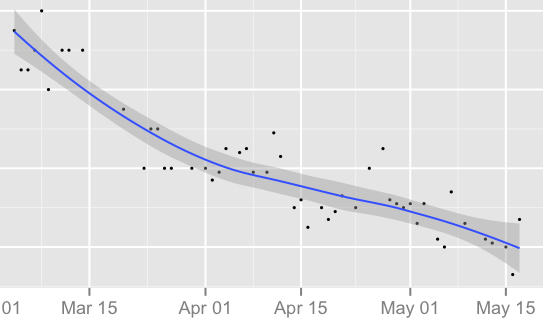
I was sad to hear that Seth, who discovered this bizarre diet, passed away recently. He was a delightful character. So much of his work is wonderfully thought provoking. I hope someday the forces which be will around to doing a formal study of even a few of the things he seems to have discovered.