 Since I’d recently been browsing various explanations of the Labor Theory of Value the meaning of this illustration seemed obvious. Labor is combined with capital’s assets to create value; but I am informed that the illustration is actually intended to render a saying. “There is always a way to a rich man’s money.” Which is entirely different, right?
Category Archives: wealth
34 cents a day
I recalled that the nation’s forefathers flirted with the idea of repudiating the revolutionary war debt. That reminding is care of the recent spectacle of our president flirting with the a similar idea.
The US debt is 7.7 Trillion, which I gather we borrowed from the rest of the planet. The world population is 6.37 Billion which comes to about $1,200 per person. Alternately, the run rate is about 2.15 Billion a day, or 34 cents a day per person. Half the planet’s population makes less than 2$ a day. Seems grim.
From the point of view of the debtor, there are around 100 Million households (pdf) in the US; 77 thousand dollars per household.
I seem to remember the French got deeply into debt at one point, but the nobility disinterested in raising their own taxes declined to address the problem. The impasse gave rise to some innnovations: the guillotine and driving on the right.
It would be interesting to read a history of the last few centuries couched just in terms of national debt, war financing, and the fortunes made and lost in it’s wake. Lots of money to be made if you have political power to play with a nation’s credit.
Intergenerational Income Patterns
One of the ways to get a El Curve is to take a population and iteratively reward the winners slightly in each round. This appears to be the model that gives rise to power law distributions in things like oil reserves. So I’m always interested in research that looks at the details of the iterative process in the vicinity of a system that exhibits an El Curve. Income for example.
From Brad DeLong
Very nicely done: very much worth reading:
Sam Bowles and Herb Gintis (2002), “The Inheritance of Inequality,” Journal of Economic Perspectives.
That really is a marvelous paper beautifully and carefully written. Fascinating.
I did not know that back in the 1960s there was a consensus that the data showed America to be the land of opportunity, i.e. that your parents’ caste did not tend to dictate your own. I gather from this paper that this was wrong due to an assortment of errors in the design of the studies.
Today we know that if you’re born poor your chance of rising is small; the poverty trap. if you’re born rich your chance of dying poor is small. The authors think it’s unlikely that this second syndrome will come to be called the affluence trap.
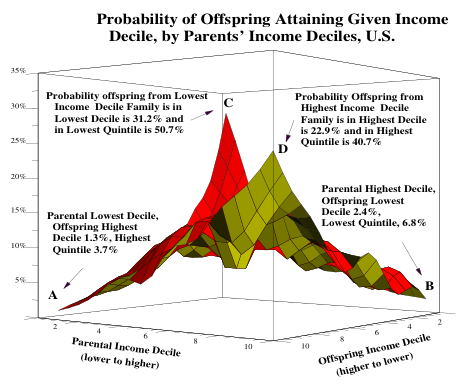
Under some definitions of fair the maximally fair society would give each child an equal chance at various levels of income. In American society if your parents had high incomes chances are your income will be high. A child born of parents in the top 10% has a 40% chance of ending up in the top 20%. If your parents were dirt poor then it’s very unlikely you will have a high income. Children born into the bottom tenth have a 3.7% chance of getting into the top 20%.
The paper includes this great peice of eye candy. This shows the chance a child will fall into a given 10% of the income range given his parents’ position in that range. The two peaks are the poverty/affluence traps.

The fun thing about the paper is the very careful attempt they make to tease out of the data some information about the causality of the intergenerational income status trap. The extent of the trap is really amazing. If you average income over 15 years then the correlation is .65. That means there is a 65% chance that the next generation’s income will be within 1 standard deviation of the previous ones.
Of course what one wants to know is what’s the causal chain from one generation to another. For example maybe the key driver of wealth is a sense of humor (though i doubt it) and parents tend to pass that on to their children a bit by nature and a bit by nurture. The nice thing about the paper is that they make a really substantial effort to draw out of the data as much causality as possible. This is almost impossible since there are plenty of causal chains for which the data is very very thin.
Of course all this stuff is very tangled. Wealthy parents tend to buy more schooling, for example. The trick is to condition the results so you’re getting a reasonably pure contribution from each stage. I.e. so if you doubled the schooling without changing the parent’s wealth your model would predict accurately what the change in outcome would be. That’s really hard. For example it’s common to use data about twins or brothers to try and tease out the differences between nature and nurture. But even that’s very subtle. For example we know the height is very tightly tied to genetics but we also know it varies tremendously depending on how well people are eating. We know that brothers tend to have very similar incomes, unless you partition the data by race at which point you discover that black brothers are extremely highly correlated and non-blacks much less so. They do a beautiful job of stepping thru this mine field.
Here are the numbers they manage to pull out of the data:
- 4% IQ
- 7% Schooling
- 12% Wealth
- 2% Personality
- 7% Race
The key result of the paper is that 32% of the trap remains unexplained. It’s something else. Humor say.
I still have an affection for my five ways to get rich model (pick the rich parents, spouse, pocket, card, or trade).
The fruits of economic growth
In today’s New York Times Paul Krugman points out that if you run the numbers the plan to privatize Social Security has contains a Catch 22. For it to work you need to have extremely healthy stock returns for 70 years. He’s an economist, he assumes strong economic growth would drive that. He then points out that if we’re having strong economic growth payroll tax revenue will rise too. Opps, wait, how embarrassing. Wouldn’t rising payroll taxes eliminate the “crisis.” Indeed they would.
But is this truly a Catch 22? It assumes that capital and labor will split the fruits of economic growth? That’s an old fashion idea; strong economic growth need not lead to rising payroll taxes. Consistently over the last 25 years the split between capital and labor has shifted sharply toward capital. Shifts in the tax system, shifts in the wealth/income distribution have worked to assure that. That’s what Republicans do. That’s their goal and they have been succeeding. There is no Catch 22 here, just another symptom of a consistent plan. Capital gains is most moral.
Freedom and Free trade
Here’s a little model, a kind of cargo cult mimic of something an economist might do. The point of this little exercise is to illustrate a point about free trade and freedom. These two ideas get confounded with each other. The primary benefit of free trade is that it increases total efficiency and that’s presumably a social good. My take: when you let loose the dogs of efficiency it displaces diversity of practice. That forces switching costs born disproportionately by the weaker side. Traditional models emphasis the weaker industries bear the switching costs. That seems ethical. This model suggests that the costs are born by innocent victims of displaced platforms of standards.
Consider two economies North and South divided by a river which precludes trade between them. In a brilliant act of engineering and social enlightenment a bridge is built that links the two. Trade happens, economic growth is unleashed. All is well with the world.
But wait! The economy on the South side of the river drives on the left side of the road; while the economy on the North side drive on the right side of the road. In all other ways the two economies operate using the same standards. Is this situation stable?
I don’t think so. It seems to me that as the two economies grow increasingly linked one side will be forced to switch their driving standard. The cost of that switch will weigh very heavily on one economy. Which one will be forced to switch?
I think it’s clear that barring exceptional facts the smaller of the two will be forced to switch.
What would this switch cost the smaller economy? We have plenty of stories of switches like this – always a smaller or conquered land switching to gain compatibility with the standards of a dominate power. For example the Germans forced the Austrians to switch during the second world war.
Driving side is a good example because it carries no credible argument for one choice being better than another. The switching costs concrete. Other examples, like switching currency or language are rife with subjective subtexts.
We know that much of happiness arises from relative position. If you know the other guy is better off than you are then that makes you sad. Consider some hypothetical numbers. The Southern economy is 80% the size of the Northern one. The bridge raises both economies GDP by 5%. The Southern economy is then forced to take a -4% hit to switch to new driving standards. But after the bridge is build and the dust settles everybody is “better off” but relatively speaking the Southern economy is now even worse off compared to the Northern one.
This is not a scenario likely to make the population of the Southern economy desire that a bridge get built. From their point of view this is a scheme on the part of the Northern economy to force them into a more subordinate position. The bridge makes the southern economy richer, but less more subordinate and less happy.
State Schools
I find this horrific.
“More members of this year’s freshman class at the University of Michigan have parents making at least $200,000 a year than have parents making less than the national median of about $53,000, according to…”
Gapminder!
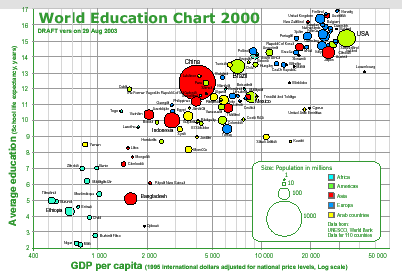
These gapminder charts are just marvelous. They are a exemplar of what we should expect from data presentation going forward. Printed data’s days are numbered.
They are also amazingly thought provoking. Just for example try out the flash based display of world income distributions. Notice how Japan’s distribution of income has become more equitable and narrow over the last twenty years. Notice how the breadth of incomes is so wide in some nations. Notice how Brazil has two peaks in it’s income distribution. Notice the same pattern emerging in the US income distirbution.
Almost all the examples are as facinating to dig into. The presentation on human development trends is particularly so. Showing as it does that the 1990s were not a particularly happy decade.
Possibly the hardest problem on the planet is how to solve the problem of third world development. As far as I can tell we really don’t know what does and doesn’t work. That’s appears to be because we don’t have very good data. What have data we have is too thin to be statistically significant. The conversation is so often confounded by various faddish adgendas. Data like that shown in these charts gives me some hope that we just might start to resolve those problems.
This link came my way via del.icio.us. It continues to please me with lots of interesting links.
Go it Alone
One of the textbook examples of a network effect is the ATM network. The more ATMs in your network the more value your customers will perceive in opening a bank account with your bank. All else being equal customers will pick a bank with a larger network of free ATMs. For very small banks, those with only a hand full of offices, this became a serious competitive problem about a decade ago. To solve the problem these banks formed branded ATM networks. In my region, for example, a large number of very small banks formed a network known as SUM. The SUM network allows me to bank with a small bank but get the advantage of a large free ATM network.
So yesterday I stopped to get money and the ATM machine announced that the bank I was in had withdrawn from the SUM network. My first reaction to the bank
Distribution of Wealth
A good Paul Krugman article about the shifting distribution of wealth and more importantly a nice summary of how to shift it.
Suppose that you actually liked a caste society, and you were seeking ways to use your control of the government to further entrench the advantages of the haves against the have-nots. What would you do?
One thing you would definitely do is get rid of the estate tax, so that large fortunes can be passed on to the next generation. More broadly, you would seek to reduce tax rates both on corporate profits and on unearned income such as dividends and capital gains, so that those with large accumulated or inherited wealth could more easily accumulate even more. You’d also try to create tax shelters mainly useful for the rich. And more broadly still, you’d try to reduce tax rates on people with high incomes, shifting the burden to the payroll tax and other revenue sources that bear most heavily on people with lower incomes.
Meanwhile, on the spending side, you’d cut back on healthcare for the poor, on the quality of public education and on state aid for higher education. This would make it more difficult for people with low incomes to climb out of their difficulties and acquire the education essential to upward mobility in the modern economy.
And just to close off as many routes to upward mobility as possible, you’d do everything possible to break the power of unions, and you’d privatize government functions so that well-paid civil servants could be replaced with poorly paid private employees.
Variations on these are exactly the same as what you do if you want to increase the slope of market concentration or the dominance of a given standard.
For example if your trying to increase the concentration in a market you want to make it harder for the small players to get access to supply (that’s analagous to cutting off health care to the poor). Or you might want to raise regulatory barriers such that strong players have a scale advantage in meeting those new requirements (standardized testing for example).
The article that Krugman cites refers to “Wal-Martization” as causal factor in the increasing disparity of wealth and the falling mobility between classes. That’s exactly right, as Wal-Mart has consolidated the retailing industry they have created increasing barriers to the ablity of small firms to reach consumers. So, for example, when Wal-Mart requires RFID tags or EDI support from their suppliers they raise barriers that assure only larger suppliers can survive. It’s a commercial twist on the old chestnut of excessive goverment regulation.
One aspect of the whole distribution of wealth debate that goes under reported is, I believe, a blindness to the effect on small businesses. I’d be very surprised if it weren’t true that what ever is true about the distribution of individual wealth wasn’t exactly true about the distribution of firm wealth. I just don’t see why there would be a meaningful difference between these two kinds of economic entities – in a macro economic sense.
Always Low Prices Always
The cleaning crews did not receive health insurance and were paid below the minimum wage, sometimes as little as $2 a day, a federal official said.
– USA Today via Body and Soul
Five of the ten richest people in the US are Waltons
