Category Archives: power-laws and networks

Northwestern United States – Earthquake

Once upon a time geologists believed that, unlike California, the Pacific Northwest was pretty stable.  Earthquakes?  Not to worry.  Other than a few Native American folktales, it’s been quiet since settlers showed up.

But, I’m reading “Cascadia’s Fault: The Earthquake and Tsunami That Could Devastate North America” (library, amazonblog) which explains how they came to change their minds about that.

Now they think that something pretty horrific is in the cards.  If you can sublimate what that means it’s a very cool detective story.  I particularly like that they know exactly when the last monster quake occurred: 9pm on January 27th, 1700.  They know this because of extensive written records of the Tsunami it caused hitting the coast of Japan.  They know this because they found trees still standing in salt marshes, killed when the ground sank and the saltwater killed them.  They pulled the well preserved roots from under the mud and counted the rings.

They have core samples of the off shore mudslides that the monster quakes have created.  Using techniques from the oil industry they can match up the wiggles in the core samples taken from these samples they can puzzle out a history for these monster quakes that goes back a long way.  They can draw a sobering timeline (click to enlarge).

CascadiaTimeline


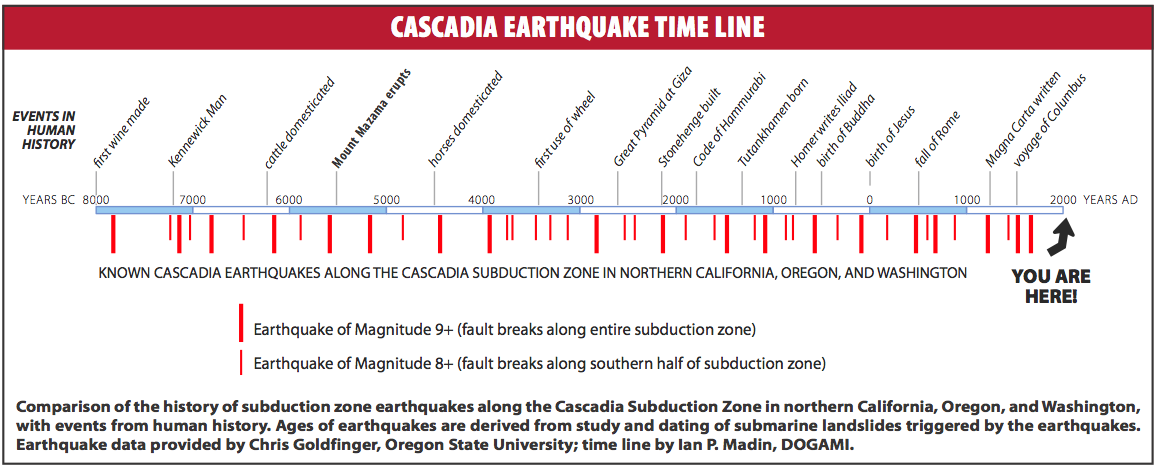
They know the mountain tops are slowly squeezing together.  These days they can watch the mountains of the entire region move, every day.  They can sum up how much stress has accumulated.  Around 60 feet of slippage will be unwound by the next quake.  The big ones on that timeline are magnitude 9.  No city with sky scrapers has have ever experienced that.  The 2011 Japanese Tsunami was triggered by a one.

So, the state of Washington has a brochure.   It suggests that most every bridge in the state will collapse.

ps. Mimi and I will be in San Francisco the last weekend of July; for the Renegade Craft fair.

Metering, discriminatory pricing, subscriptions … Adobe.

Pricing is a mess.  On the one hand you can argue that things should cost exactly what they cost to produce (including, of course, a pleasant lifestyle for their producers).  On the other hand you can argue that they should cost exactly whatever value their users extract from the product. Surplus is the term of art.  If you charge less than the value extracted the consumer is left to capture the surplus value.

More than a decade ago I had a bit of fun at the expense of my employeer arguing that we should switch all our pricing to subscription, just as Adobe has just recently decided to.  My suggestion was greeted with an abundance eye rolling and head shaking.

Leaving surplus value on the table can be very risky for the producer.  It’s not just about how pleasant a lifestyle he get’s (aka greed).  Businesses are multi-round games; what you can invest in the next round of the game depends on how much of the surplus value you capture v.s. your competitors.   But also businesses with large market share and large volumes gain scale advantages that drive down costs, establish standards, and generally create positive feedback loops.  (That leads to the perverse tendency for the largest vendor to be the best and the cheapest.)  Which brings us to discriminatory pricing, aka value pricing.

The demand side network effects depend on the scale of your installed base.  Discounting lets you reach users that you wouldn’t otherwise.  If you can segment your market then you can enlarge it.  There is a standard text book illustration for this.

priceing

That chart shows the number of buyers your product will have if you charge various prices, or looking at it another way it’s showing you how much value users think they will get from your product.  If you’d like a lot of users you should charge the green price.  Your total revenue is, of course, the volume of the rectangle.  Why not both?  Why stop there?   As a vendor, what you’d love charge everybody exactly what they are willing to pay.  You could have both the maximum number of users and all the volume (revenue) under that curve.

Subscription pricing gives you a tool, because it lets’ you meter usage, that can stand in as a proxy for the value the users are getting from the product.

I was surprised by Adobe’s subscription pricing, not because it’s expensive and draconian.  No, I was surprised because it appears to have no metering.  My insta-theory for why?  Well I think what we are seeing at this stage is the classic: e.g. “list price.”  That they will start offering various discounted variations on the service.  It would be odd if they don’t.  Because, otherwise, they are leaving two things on the table.  They are shunning a huge pool of users, missing out on all the demand side network effects they create, and encouraging competitors to fill into that abandoned market segment.  And, they are leaving money on the table.

I’ve no idea what they will meter, but I’d be surprised if they don’t.


Big Warm Blooded Animals

This is a lovely simple article: How Large Should Whales Be?  It’s a simple article because it builds on an earlier article about the sizes of land mammals.

The model in the article rests on some stylized facts about animal size. Fossils show that over time species tends to get larger; we can presume there is a benefit to being larger.  Warm blooded animals have a minimun size; if your tiny it’s hard to keep warm. Most warm blooded animals are about the size of a large rat (or squirrel).  Which doesn’t really make sense since we already said that larger is better.

The tension between the advantages of size and the fact that most warm blooded animals aren’t huge is – they say – about extinction. On the one hand it takes time to evolve into something huge and on the other hand the speicies is always at some risk of going extinct. This is almost enough to build a model that explains the distirbution of sizes for warm blooded animals. We need only one more detail – i.e. that larger animals are more likely to go extinct. I gather the model works extremely well.

animal_size

The paper just extends the model from land to sea. Showing that the model works very nicely for whales and such. It’s harder to keep warm in the water, so the minimum size for a aquatic mammal is larger than that of a land mammal. My favorite factoid from the paper is that land mammals moved into the water as soon as grew larger than the warmblooded aquatic minimum.

Why are larger species are more likely to go extinct? It’s bit counter intuitive. Size has a short term advantage, otherwise they wouldn’t evolve toward larger sizes.  A large animal has, in effect, a larger bank account and that let’s him buffer life’s vicissitudes.  But why would it be good in the short term and bad in the long term.  A possible logic is that any species resides in some niche, and it’s a bigger then you get a smaller population filling the niche. Small populations are easier to wipe out.

I don’t really see any hope that this model is useful in other contexts closer to my interests: firm size, wealth distributions, city size, etc.  Their size distributions don’t look like that illustration, not at all.  They have much longer tails to the right.  Suggesting the extinction events are rare for them.  But it’s an amusing exercise to try. Look for the analogies to theromodynamics, evolution, and extinction events.

Specialization

When I graduated from college I had a firm opinion.  I felt I had to move to either Boston on San Francisco.  This was based a book I’d read. Jane Jacob’s book about the economic basin that surrounds a city.  Here is a nice lecture she gave in 1983 about the topic.  The gist of this idea is that there is some sort of industry specific network effect that creates powerful positive feedback loops for a given industry such that industries tend to concentrate into a single, or maybe a few, locations.  I figured I had to go where my industry was concentrated.

There are plenty of stories you can tell that are pretty compelling about this.  For example there are towns in China today that make only buttons, and other towns that make only copies of classic oil paintings, etc. etc.    Everybody knows that Silicon Valley has something in the water that means that only there can you do high-tech.

But recently I’ve gotten to wondering, maybe this isn’t true.  Cities, as a economic model, lost much of their competitive advantage with the introduction of the phone (which undermined

the manager’s need to be on site), electricity (which undermined the requirement for power/coal to be delivered via flat water), and modern transportation (which undermined the requirement to walk to work).  Once those all set in the city centers dissipated.  And thus, the golden age of American cities ended.  Is that process over?  I think maybe not – the way that the internet has enabled distributed work is a good example of the ongoing process.

How might we measure this?  Apparently Paul Krugman suggested some time ago the seemingly obvious idea that you just compare “the sum of the absolute differences in industry shares of employment between the two regions.”  (page 12)  And in 1998 this paper was published with this chart that shows the historical trends in regional specialization in the US.  Notice first the bottom line – retail trade; all regions have some retailing so that isn’t concentrated.  Then notice the top one; apparently the least urban activity is the one that is trending toward increased regional specialization.  I certainly didn’t expect that.

What leaps out at me here is the way the rise and fall of regional specialization in manufacturing appears to be so correlated with the gold-age of American cities.

I think I was right at the time.  Wrong about my choice of cities; San Francisco beat Boston – a lot.  I remain unconvinced that we know exactly why though.  These days I still think it is good advice to the young, go someplace where there is an existing network of people doing what your interested in.  But, that said, I think it’s less critical than it used to be.  And, I’m totally confused about that agriculture trend line.


Brainstorms and Powerlaw

Here’s another power-law.

Apparently the distribution for the interval between  epileptic seizures is a power-law.  The long intervals are rare.  There are lots processes that give rise to a power law distribution.  The proposed model in this case involves a cascading failure in the  network of neurons.

I don’t think this next paper has undergone peer reviews, but in  this paper  they look at the interval between a serial killer’s murders.    That’s a thin data sample.  The interval between his crimes is power-law distributed.

Interesting example of impulse control, will power power, etc.

I wonder if we have other data on brainstorms?  Brainstorms of a less horrific kind:  interval between blog posts, emails, phone calls, code commits, sales closed, etc. etc.  What if we took the top hundred poems Robert Frost wrote and measured the interval between their creation?    Would we see that as power law distributed?  With enough data we could probably look into the effect of coffee on brainstorms.

Equality and Opportunity

The US is no longer the land of opportunity.  If you want that, move to the Nordic countries.

The vertical axis on this chart is a measure of how likely you are to have an income that differs from that of your parents.  The horizontal line is the usual measure of income inequality.  So if you live in the UK or the US I recommend picking good parents.


Economic growth v.s. social well being

Over the years I’ve spent a lot of time thinking, reading, etc. about economic inequality.    This talk (ted)  is amazing, and in a sense it comes down to this chart, which answers a key question: what is income inequality correlated with?

So we now know that income inequality has high social costs, or to say it in a more technical way inequality is negatively correlated with social welfare.  I don’t know that would surprise most people.    A society where the lower classes are more distant from the upper classes is going to have greater social stress – at least I don’t see that as surprising.

But what else is income inequality correlated with?    There is a very scary possibility:  That inequality drives greater economic growth.  Not hard to make up an insta-theory for that: e.g. that the social gradient drives people to strive, and this drives significant economic growth.  Or, that economy’s of scale assure that larger systems will lead to higher growth, and those large systems are naturally inclined to concentrate wealth in their owners.

That would be really horrific.  A Hobson’ choice: pick one economic growth or social well-being.  If you don’t pick the norms that lead to highest growth other nations will then run grow you.  That’s not good, because with growth and scale comes power.   And, societies that grow faster carry their social norms carried along with them.  They become the standard.

So, it’s a very important question.  And you’d think there would be libraries full of research on this question.  There are not.  Pick your insta-theory for why that is.  As far as I can tell the data seems to suggest that growth and inequality are inversely related.  Which is a relief.  It is very frustrating that this is not a settled question.


Why Google’s Troubles Run Deep

This may be the only thing (archive.org) I’ve ever read that made me actually want to work at Google.  First off, ignore the stupid framing and scroll down to the actual content.
Let me pick some quotes.

Writing about Amazon: “Organizing into services taught teams not to trust each other in most of the same ways they’re not supposed to trust external developers”

Or writing about a fundamental truth: “Accessibility has an evil twin who, jilted by the unbalanced affection displayed by their parents in their youth, has grown into an equally powerful Arch-Nemesis (yes, there’s more than one nemesis to accessibility) named Security. And boy howdy are the two ever at odds.”

But then getting to Google’s deepest fundamental tragic flaw: “one last thing that Google doesn’t do well is Platforms” … “product is useless without a platform”  …  “.Google+ team took a look at the aftermarket and said: “Gosh, it looks like we need some … Let’s go contract someone to, um, write some… for us.”  … “Any teams that have successfully internalized the notion that they should be externally programmable platforms from the ground up are underdogs” … “The problem is that we’re a Product Company…”

ok, nevermind.  But,  I think it’s shockingly exactly right and in the long run it’s not a bad reason to short Google.

If I’ve peak’d your interest read the whole thing (see archive.org now)

I suspect this says something about  Hal Varian’s status in the senior leadership.  I presume he understands this.  But maybe not how fundamental it is.

where the money is

A useful chart:

Income is never distributed uniformly.  What matters is how severe that becomes.  Since what the top 10% want from their tax payments is fundamentally different from what the other 90% want this leads directly to class warfare.  Denying that isn’t insane.  The top 10% don’t need the government to provide: health, schools, etc. etc. — at least not outside their increasingly isolated enclaves.  Which in turn is why your schools, your healthcare suck, your safety net suck.