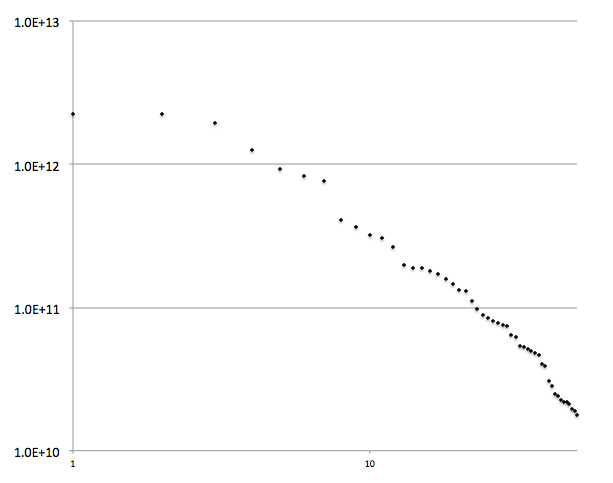
This topic came up today, and since I have a large collection of charts like this I thought I’d add this one.
This is the log-log graph of the top 50 banks based their assets. The vertical axis is dollars; i.e. there are four banks with over a 1e12 or a Trillion dollars in assets.
