Here’s some more chart porn of house prices. This chart shows the HPI for five major US cities for aproximately the last 30 years. It shows, for example, that I bought my house at the peak of a price bubble back in the 1980s. Part of the problem here is I don’t really have any idea what to compare this index to, cpi?, gdp?, interest rates?, demographics?, politics?

LA is currently the one with the highest index, it’s also the one who’s bubbling lagged the during the 1980s. Note how housing was a lousy investment during the 90s and to a limited degree the recent run up in prices looks at if it might be compensating for that. You’d see a much wider range of in the recent price runs if you had data for more areas. If you want to play with this data it’s available on this page in various formats for lots and lots of metropolitain regions, they aren’t very picky about what counts as metropolitain.
Category Archives: economics
Housing Prices
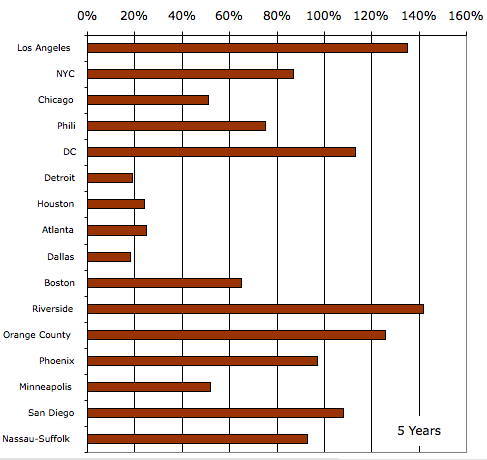
The chart below shows the five year rise a housing price index for the top handful of metro regions.

Presumably some of the varation from one region to another is grounded in fundamentals while some is irrational exuberance.
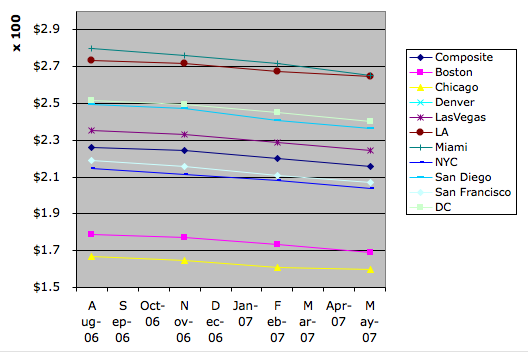
Meanwhile one of the future’s markets has a thinly traded product you can buy. In a perfectly functional market that would be your best estimate of what the future holds. This chart shows the price as of yesterday for a contract on a somewhat different housing index for various dates in the future. You can see that they are all falling, but also that there is little variation from one region to another; at least nothing to compare to the variation in historical price rises.

This was all triggered by reading a story this morning of a seller in Washington who entered the market asking 1.1 million and sold after an auction for half that.
Bah
Mast Year, Network Failure, and Information Cascades
Tree’s don’t get around much, but they still engage extremely syncrhronized behaviors. From time to time all the trees of a given species though out a region will decide to throw a party. These are known as mast years. In these years all the trees in the region will produce vastly more seeds than in other years. It’s an orgy! The distribution of seed production/year is highly skewed with the majority of seeds being produced in these mast years.
I’ve been thinking about power failures, in particularly electrical power failures. Random failures in the power grid pop up all the time, but with surprising regularity large swaths of the power grid fail. I suspect that if you had a plot of the # of customers-days of various failures you’d get a highly skew’d distribution. We know a fair amount of why these grid failures happen. The grid isn’t a grid, it’s a scalefree network. If it were more like a grid then it would be more robust; but a grid is expensive compaired to a scale free network. The grid failures arise because a random failure hits some reasonably key component and then the rest of the grid fails as the problem cascades thru the network.
For example last summer, or the summer before, we had a power grid failure across the megalopolis on the east coast of the North America. The network was running at capacity that hot day when something near Ohio failed. As the load shifted the safety triggers on other components decided that they should resign from the network – to protect themselves. Each resignation accelerated the cascade and soon a hundred million people were without power. I found that interesting at the time because it makes a link between the issues of pure go-it-alone self interested capitalism and the issues of collective good. We have been playing out a recent enthusiasm for handing public goods over to private actors here in the US. These private actors have trouble successfully coordinating the building of enough excess capacity and reliablity into their networks. As the network failures become more likely the individual actors, seeing that their capital equipment is more at risk, tend to shift their safety triggers down; or at least i presume they would.
This year we had a example that’s worse, in it’s way, of a power grid failure. The grid in Queen’s New York failed. This time it appears the the safety triggers were set too high. Again during record load a component failed; but this time as the failures cascaded other components stayed loyal to the network with the result that rather than resign they committed sucide. Which is way bad because to reboot the system they have to pull new cables to replace the ones that burnt out.
Both those models are, to be clear, entirely speculative. But I’d love to know if after the first failure the guys in Queens went around and readjusted thier safety triggers.
The mass years, presumably, are information cascades thru some communication channel the species members have stumbled upon. I bet that when they figure it out they will discover that larger groves of trees play a role in triggering a successfull cascade.
Trees, like other members of the ecology, are embedded in an web of inter-species relationships. Observers have noticed that the mass years throw quite a ripple thru that web. The squirrels get fat when oaks have a mass year. They have lots of offspring. The orgy cascades. The population bubbles and the next year it starves. This pattern is actually good for the oaks; who would like to get their seeds past those pests. During the abundant year many seeds get past the squirrels. The following year every acorn is found by now desperate squirrels. By the third year most of the squirrels have died and the oak can again get a lot of acorns past those pests.
I bet there are similar patterns in the supply chain web after each of these power failures. For example I bet there comes season a bit after a large grid failure when you can get a generator really cheap from a vendor who was fat and happy just a season ago.
Are Economists Smarter?
Can the economist v.s. sociologist Hot or Not? web site be far behind? (pdf)
“Hope and fear are inseparable”
Can the dollar be talked down gradually? Consensus economic models say no: once market expectations are that the dollar will be sharply lower in five years, speculators will make the dollar sharply lower tomorrow.
Nevertheless, there is hope: consensus economic models say the dollar crashed three years ago.
The Perception of Risk
Another fun item from Chandler Howell’s blog about how people manage the risk. People try to get what they percieve to be the right amount of risk into their lives, but they do this on really really lousy data. So there are all kinds of breakdowns.
For example you get unfortunate scenarios where actors suit up in safety equipment, this makes them feel safer so they take more risks and after all is said and done the accident rates go up. Bummer!
I’ve written about how Jane Jacobs offers a model for why Toronto overtook Montreal as the largest city in Canada. After the second world war Toronto was young and niave with a large appetite for risk; while Montreal was more mature and wise. To Toronto’s benefit and Montreal’s distress the decades after the second world war were a particularly good time to take risks and a bad time to be risk adverse.
I’ve also written about how limited liablity is a delightful scheme to shape the risk so that corporations will take more of it. All based on a social/political calculation that risk taking is a public good that we ought to encourage.
What I hadn’t apprecated previously is how this kind of thinking is entriely scale free. Consider the fetish for testing in many of the fads about software development. The tests are like safety equipment, they encourage greater risk taking. Who knows if the total result is a safer development process?
It’s Never about the Chicken
Martin was shocked. He’d purchased an options contract for some travel related services and when he wanted to renegotiate the terms his world model was shaken by the discover that the other party had failed to mention that his contract included the option change the terms. as he desired, for free!
Martin and I share the affliction that we now see all transactions in terms of option value. They aren’t exchanging a chicken, they are reshaping their personal and joint option spaces. It’s a delightfully wierd way of looking at the world.
I wonder though, has anybody told Martin about RyanAir’s policy that you get a free Creme Bruelee just for asking?
Private Currency Systems & Ebay
EBay recently posted a policy for payments that, using their power as market makers, regulates the currency substitutes which sellers are allowed to utilize for their transactions. It’s an interesting read. It provides a pretty wide ranging tour of some of the ways people have found to create currency substitutes.
For example I just love this section where precious metals and frequent flier points are lumped into one category “… payment model involves precious metals, or other non-cash (points, miles, minutes, coupons, discounts) …” who knew? At that point I’m find I’m wondering if people are actually selling things on eBay in exchange for long distance minutes and loyality club points?
I’m amused that eBay has declared cash to be verboten. In effect taking the default currency system and eliminating it as a competitor for PayPal is clever. They frame it up as about safety, but of course it also has consequences on anonymity and transaction costs.
Private Currency Lost in the Sofa
It’s hard to get a handle on all the ways that a private currency operator can profit from his franchise. But one of my favorites is having the loose change slip between the sofa cushions never to be seen again. The accounting rules for these things must be a mess. One of the reasons why the folks that issue gift cards like for them to expire is somewhat like the reason why firms like to make your vacation time expire; otherwise they have to do something to keep it on their books.
So today Home Depot announced it was going to claim 50+ Million Dollars that it’s pretty sure it’s customers have lost in the sofa since they bought them.
The article also reports that $55 Billion dollars moves into the private currency systems call gift cards every year; it doesn’t estimate how much manages to get back out v.s. slip into the sofa. I find that number a bit bewildering; there are 100 million households in the US; or so that’s $550 per household. I presume that the distribution over households is skew’d (since that’s my default presumption for distributions involving exchanges). I can imagine that there are people who build entire houses via gift cards; but still! Most of the gift cards are capped to hold only a maximum of $500; so it must get pretty weird for the high volume gift card users.
But wait. The article then goes on to find an source that thinks that if you take the bank issued gift cards, i.e. Visa/Mastercard gift cards, the annual amount might be up around $100 Billion; at which point we are talking a thousand per household. The bank cards are more fungible so I suspect some of those get shipped over seas; then possible some of the regular gift cards do too?
“spokesman for … Best Buy. ‘We really believe gift cards are all about convenience.'” What he means is, of course, they is very very convienient for Best Buy.
