Category Archives: economics

Tax the Rich

Why have the top few percent have taken over such a large part of the economy?

TaxTheRich


That chart (source) shows that lowering their taxes plays a very large part in the story.

Is this due to economic fundamentals (aka: globalization, computers, the rise of winner take all business models), or a simple political victory by agents of high income individuals?

Frightening the Baby Boomers

This report has an interesting detail.  It mentions in passing that men between 55-65 continue to participate in the labor force at roughly pre-recession levels.  All other groups have sharply reduced levels participation rates.   Increased economic uncertainty has scared them into holding onto their jobs.  They did not to retire.

This and that

This emerging story of how the major banks have been misreported the interest rate they were paying to borrow/lend money to each other is beyond outrageous.  The LIBOR (London InterBank Offer Rate) is has many uses and this fraud corrupted all those uses.

For example it signals what the market thinks about the stability of the banks, so by reporting the wrong values the banks were hiding their instability.  There is no doubt that if they had reported it accurately then at least some people would have reacted.  For individual investors those reactions could have saved them from huge loses.  For regulators it might have reduced the magnitude of what happen in the world economy.

But that is not why the banks were engaged in this fraud.

It’s not often you get to talk about quadrillions of dollars; but this is a good time.  The US economy in total produces around 15 trillion dollars a year.  But there are financial instruments around which 500+ trillion dollars worth of trades happen a year.  The LIBOR forms the foundation for  some of these instruments.  The banks undermined these markets by manipulating the LIBOR.  It looks to me like quadrillions of dollars of transactions are now in doubt.

I’m reading “Red Plenty”.  It is, sort of, a series of short stories about the Soviet Union’s experiment with central planning.  Each story is a beautifully written; with sympathetic and complex characters.  I was delighted to encounter in the midst of it a story about  a middleman.  Literature where the middleman is the hero are exceptionally rare, but apparently not entirely so.

One of many threads that runs thru the book is how the central planners are caught between a rock and hard place.  For example at one point the eggheads point out that nobody can create a supply meat at the regulated price and convince the planners that if only they would raise the price of meat sufficiently then there would be meat.    So, they raise the price, the workers complain, some of them step into the streets, some of them gather in the town squares.  Some local officials say unfortunate things.  Soon men appear on roof tops and bullets tear into the crowd.

A problem of central planning is that you lose the plausible deniability that markets provide.  When the market raises the price of meat the public doesn’t march out of the office building and into the town square; and even if does the elite merely shrugs and mutters:  “Tell it to the invisible hand.”

But in sense that’s not true.  Political scientists assure me that the single most potent predictor in electoral upsets is the public’s sense of how much better or worse off they are v.s. 12-18 months ago.  So the embrace of a market economy v.s. a centrally planned one doesn’t entirely shield the political elite from the being asked to take responsibility for hard choices.  One group of the elite capture the benefits for disruption while others are take the blame for the resulting displacement.

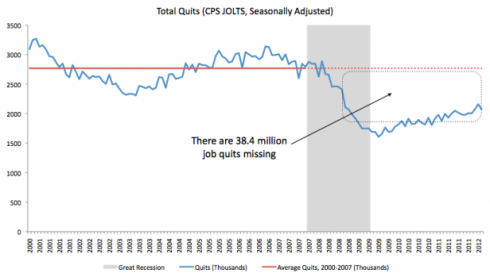
This chart from Mike Konczal  illustrates a fascinating statistic that I didn’t realize the government collects – how many people quit their job.  Mike posts this statistic because of a conversation that’s broken out in one corner of the blog-o-sphere about – a worth conversation about how if we are to go all gushy about “freedom” we really ought to spend some calories discussing “freedom” inside of commercial contexts.  In particular how much or little freedom most employee’s have.  Unsurprisingly there are people on the Internet who whole some pretty outrageous opinions.  For example that there’s not problem with the boss insisting that you sleep with him, or wear diapers rather than use the bathroom; since your always free to quit.

Quiting is, is of course, one of the ways firms get clear feed back about their employment regime.  If lots of your workers quite, presumably you might adjust your terms of employment.  Hershman wrote a nice book about this “Exit, Voice, and Loyality;” where in he makes short work of the fanciful presumption that exit – the best loved feedback signal of simple economic models.  Early in the book he allows as the claim that exit works as a feedback signal has no experimental data to back it up.

What this chart shows is that when the economy tanked people stopped quitting in droves.  Apparently 38 Million corrective signals have gone missing.  What can this mean?  Three thoughts come to mind.  Employees have become significantly more loyal or vocal.  Employers have become much nicer.

Where are the statistics on the volume of employee voice?
Little Pirates

This chart is a nice simple illustration as to why an investment advisor might be drawn into pitching a higher risk portfolio.  All you need to do is offer him a bonus if the portfolio performs particularly well.  This creates an incentive for him to offer you investments drawn from the blue portfolio v.s. the green portfolio.

This chart is lifted from this provocative paper: “Low Risk Stocks Outperform within All Observable Markets.”  It’s role in the paper is to argue that this incentive, the tendency of advisors to prefer the blue to the green portfolios, leads to high prices for the blue stocks.  Thus, they become overvalued and lousy investments.

What I find interesting about that is how complementary it is to my theory of Capitalism as the direct decedent of Piracy.  E.g. here we have agency effects creating an incentive for the investment advisor to put his client into more volatile (riskier?) investments, but through the wonders of agency (aka limited liability) he bears no downside for that.

ht: Bob Wyman.

Specialization

When I graduated from college I had a firm opinion.  I felt I had to move to either Boston on San Francisco.  This was based a book I’d read. Jane Jacob’s book about the economic basin that surrounds a city.  Here is a nice lecture she gave in 1983 about the topic.  The gist of this idea is that there is some sort of industry specific network effect that creates powerful positive feedback loops for a given industry such that industries tend to concentrate into a single, or maybe a few, locations.  I figured I had to go where my industry was concentrated.

There are plenty of stories you can tell that are pretty compelling about this.  For example there are towns in China today that make only buttons, and other towns that make only copies of classic oil paintings, etc. etc.    Everybody knows that Silicon Valley has something in the water that means that only there can you do high-tech.

But recently I’ve gotten to wondering, maybe this isn’t true.  Cities, as a economic model, lost much of their competitive advantage with the introduction of the phone (which undermined

the manager’s need to be on site), electricity (which undermined the requirement for power/coal to be delivered via flat water), and modern transportation (which undermined the requirement to walk to work).  Once those all set in the city centers dissipated.  And thus, the golden age of American cities ended.  Is that process over?  I think maybe not – the way that the internet has enabled distributed work is a good example of the ongoing process.

How might we measure this?  Apparently Paul Krugman suggested some time ago the seemingly obvious idea that you just compare “the sum of the absolute differences in industry shares of employment between the two regions.”  (page 12)  And in 1998 this paper was published with this chart that shows the historical trends in regional specialization in the US.  Notice first the bottom line – retail trade; all regions have some retailing so that isn’t concentrated.  Then notice the top one; apparently the least urban activity is the one that is trending toward increased regional specialization.  I certainly didn’t expect that.

What leaps out at me here is the way the rise and fall of regional specialization in manufacturing appears to be so correlated with the gold-age of American cities.

I think I was right at the time.  Wrong about my choice of cities; San Francisco beat Boston – a lot.  I remain unconvinced that we know exactly why though.  These days I still think it is good advice to the young, go someplace where there is an existing network of people doing what your interested in.  But, that said, I think it’s less critical than it used to be.  And, I’m totally confused about that agriculture trend line.


Economic growth v.s. social well being

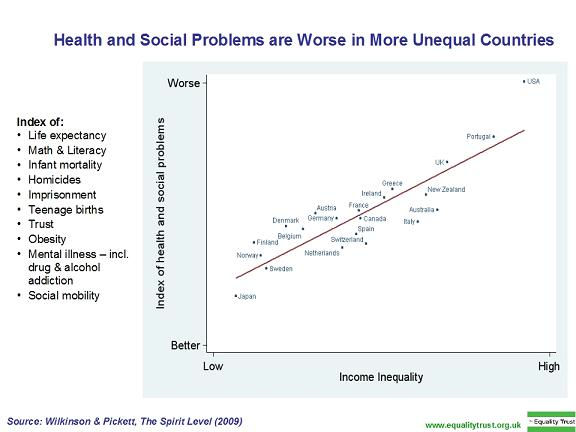
Over the years I’ve spent a lot of time thinking, reading, etc. about economic inequality.    This talk (ted)  is amazing, and in a sense it comes down to this chart, which answers a key question: what is income inequality correlated with?

So we now know that income inequality has high social costs, or to say it in a more technical way inequality is negatively correlated with social welfare.  I don’t know that would surprise most people.    A society where the lower classes are more distant from the upper classes is going to have greater social stress – at least I don’t see that as surprising.

But what else is income inequality correlated with?    There is a very scary possibility:  That inequality drives greater economic growth.  Not hard to make up an insta-theory for that: e.g. that the social gradient drives people to strive, and this drives significant economic growth.  Or, that economy’s of scale assure that larger systems will lead to higher growth, and those large systems are naturally inclined to concentrate wealth in their owners.

That would be really horrific.  A Hobson’ choice: pick one economic growth or social well-being.  If you don’t pick the norms that lead to highest growth other nations will then run grow you.  That’s not good, because with growth and scale comes power.   And, societies that grow faster carry their social norms carried along with them.  They become the standard.

So, it’s a very important question.  And you’d think there would be libraries full of research on this question.  There are not.  Pick your insta-theory for why that is.  As far as I can tell the data seems to suggest that growth and inequality are inversely related.  Which is a relief.  It is very frustrating that this is not a settled question.


a story of money

This is a fascinating interview with David Graeber, an anthropologist, about the origins of money.

For years now I’ve been convinced that where is something curiously wrong with the presumption that “the books balance.”  One way I talk about that is to ask: “Wouldyou rather die with people owing you, or with you owing them?”  Graeber gets into this in the interview; arguing that exchange exists against a deep background of existing relationships; that the entire myth about the market arises from a simplifying assumption of early economists where they start from a surely impossible initial state where the participants have no existing relationships; i.e. the books begin balanced and we continuously strive to get back into that lonely atomized state.

Graeber outlines a sharply different story about money from the usual just-so-storywe have all been told.  The fairy tale he is dismisses goes like so: barter comes first with individuals exchanging A for B.Over time traders recognize that some commodities are money like – their value is durable, they store easily, their value is easy to decern – and these commoditiesthen become units of exchange.  Later tokens appear that represent these commodities,and at that point it’s off to the races.  Graeber highlights a problem with this story, e.g. that anthropologists haven’t found any examples of this in practice.  I am surely exaggerating, but I come away wondering if barter actually exists.  He says the only place it appears to happen is when an existing currency regime collapses.

Graeber says nope.  He argues, and I think this is exactly right, that what happensfirst is that exchange takes place in the form of “I’ll give you A, and you’ll owe me.”  The “owe me” clause is part of the social sphere.  It’s in the set of books that balance only very roughly.  I’d argue the entire idea of such books coming into balance is fairly toxic to the social sphere.

In this telling the emergence of money is largely as a means to keep a measure of the extent of outstanding debt.  And curiously one place that debt appears is betweeninstitutions (clubs) and thier members – in that context the club members draw uponthe benefits of the club and in turn they accumulate a debt to that club.  In time,as the institution becomes more formal and it’s members more alienated from it themanagement of this debt becomes more formalized.  The club then introduces membershipfees, or taxes.  Money becomes that which the King will accept to pay your taxes.

It’s worth reading the entire interview, because money (reified obligation) has a design flaw; the debt trap.  And there are complex currents about it’s interplay with a societies presumptions about what is moral; and thus a societies morality.  He has fascinating things to say about slavery; debt forgiven, cycles between money as commodity (for example gold) and money as virtual, and on and on.  And possibly most importantly the balance a society based on virtual money most find between protections for debtors v.s. creditors.

Theorizing about money is fun, but try not to forget; studies have shown that 97.3% of those who do it are nuts.

Speaking of clubs … I’m now 18th in line at the public library to borrow their single copy of Graeber’s book: Debt: The First 5,000 Years.

An hour a day

Damian Dovarganes of the AP wrote this peice about the effect of gas prices on household budgets; it’s interesting how an piece like that spreads.  Google shows it in over 400 news outlets from Fox to NPR.

I am not interested in the article, but this factoid: it says that American households spend on average $369 a month on gas.  If we presume that gas cost 4$ a gallon then we are buying 92.25 gallons of gas a month.  If we assume 20 miles to the gallon we are driving 1,845 miles a month.  That’s around 61.5 miles a day.  About an hour a day in the household’s cars.  By the way, that hour is  commuting to work.

I did a posting a few years ago about car costs.  At the time time gas was 27% of the over all expense, and for example, depreciation was 25%.  At that time gas was $2.90 a gallon.

The article quotes an expert saying that there isn’t much you can do to improve your milage.  Gosh, I suspect that quote pissed off the expert; since he surely knows there is plenty you can do: air in the tires, combine trips, drive slowly and smoothly.

(fyi – the AP pretty far to the right)


Silly Surveys and Death

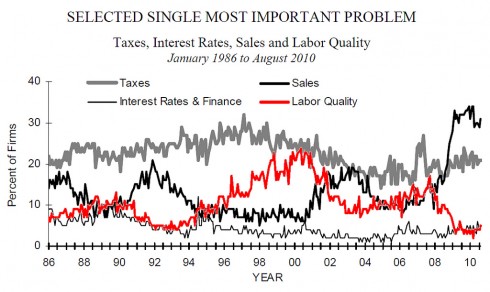
If it wasn’t so bleak I’d find this chart amusing.  I love the idea that we can reduce the worries of business owners to just four things; for sake it doesn’t even call out the five things that your freshman business major is is taught to worry about.  It is obvious this data series was intended to server a anti-government anti-tax PR agenda.

The second thing I notice is that two of the curves (taxes and finance) are sufficiently constant as to be uninteresting.  The only signal in this data series is just  the business cycle – when things are hot the problem is finding good people; when they are lousy the problem is sales.

Sadly this is a horribly bleak chart.  It shows that the recession is just awful.  It’s the worse in 25 years, at least.  It also shows who tightly coupled demand for goods is to demand for labor.  Of course it’s not surprising that if you can’t sell your don’t worry much about finding good labor.  One way to look at that red line is that it hints at what percentage of firms are hiring.

If we don’t find a way to crank up demand, e.g. sales, we are in for a long a miserable decade.

Cost Benefit Analysis

Plucked from this poignant post about externalities (which reminds me of my realization that limited liability corporations evolved from pirates)  is this bit from a Rolling Stone article.  It’s a nice clean example of cost benefit analysis in the “real world.”

BP has also cut corners at the expense of its own workers. In 2005, 15 workers were killed and 170 injured after a tower filled with gasoline exploded at a BP refinery in Texas. Investigators found that the company had flouted its own safety procedures and illegally shut off a warning system before the blast. An internal cost-benefit analysis conducted by BP – explicitly based on the children’s tale  The Three Little Pigs – revealed that the oil giant had considered making buildings at the refinery blast-resistant to protect its workers (the pigs) from an explosion (the wolf). BP knew lives were on the line: “If the wolf blows down the house, the piggy is gobbled.” But the company determined it would be cheaper to simply pay off the families of dead pigs.

Billions of years ago, in a course on Biotechnology, I got a A+ for writing a long paper outlining a cost benefit analysis for some research on kidney machines.  I’d written the entire paper in a similar sardonic tongue in cheek tone and I was shocked that the instructor seemed to be oblivious to that.  It was, I thought at the time, the most interesting lesson I took from the course.

I must look for a chance to use the The Three Little Pigs as design framework!