This is an impressive bit of chart from the Atlanta Fed. It shows a large handful
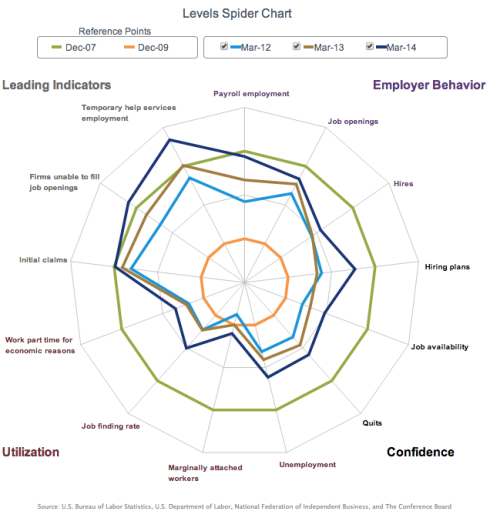
It shows three samples (March 2012, 2013, and 2014) of thirteen metrics for unemployment. The designers scaled these various numbers by using two reference points: December of 2007 and 2009. I.e. just before and after the great recession started. The reference years appear on the chart as two circles: the inner circle is the bad year 2009, and the outer green circle is the good one.
You can see how over the last three years things are getting better, but not much. The 13 metrics are in four rough categories as indicated by the labels in the corners. The metrics that tend to suggest the future have improved the most. The facts on the ground, i.e. while, aka utilization, have not improved much..
The scale selected is good, but it’s worth pointing out that 2007 was fairly disappointing. Consider this next chart.
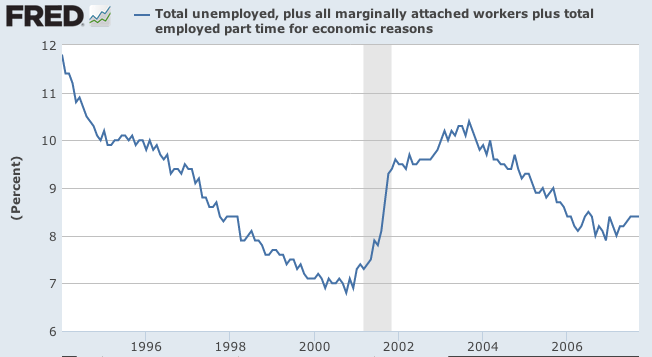
That shows the U-6 unemployment rate. The recession that followed the bursting of the Internet bubble is the gray band. So in 2007 the concern was how we seemed unable to achieve utilizations close to those of the 1990s. Shortly after this chart ends the U-6 rose to 17%+.
Another critique, I suspect payroll number (and others?) are not adjusted for population growth.