Voteview is an amazingly simple model for behavior of legislators. It takes as input the votes of the legislature and assigns each legislator a score. These scores are, surprisingly, quite stable. Surprisingly, legislator’s behavior is dependable and predictable. It takes only two numbers to model legislators with surprising accuracy. Two numbers mean we can draw scatter plots with one point for each legislator. That reveals natural coalitions.
The math doesn’t tell us what the scores mean. To puzzle that out you need to look at what the votes were about. When this technique was first discovered the first score measures the left/right (economic) political spectrum. That means things how the government aids small vs. large economic entities. The second was left/right (social); primarily civil rights, but also broader issues such as the franchise. But the two score means can vary from one legislature to another and can shift over time. The first score is a more powerful predictor and if you add a third score it hardly improves the accuracy.
Here, for example, is the vote to reduce the food stamps program. The letters indicate the legislators. The line shows how the bill partitioned the space.
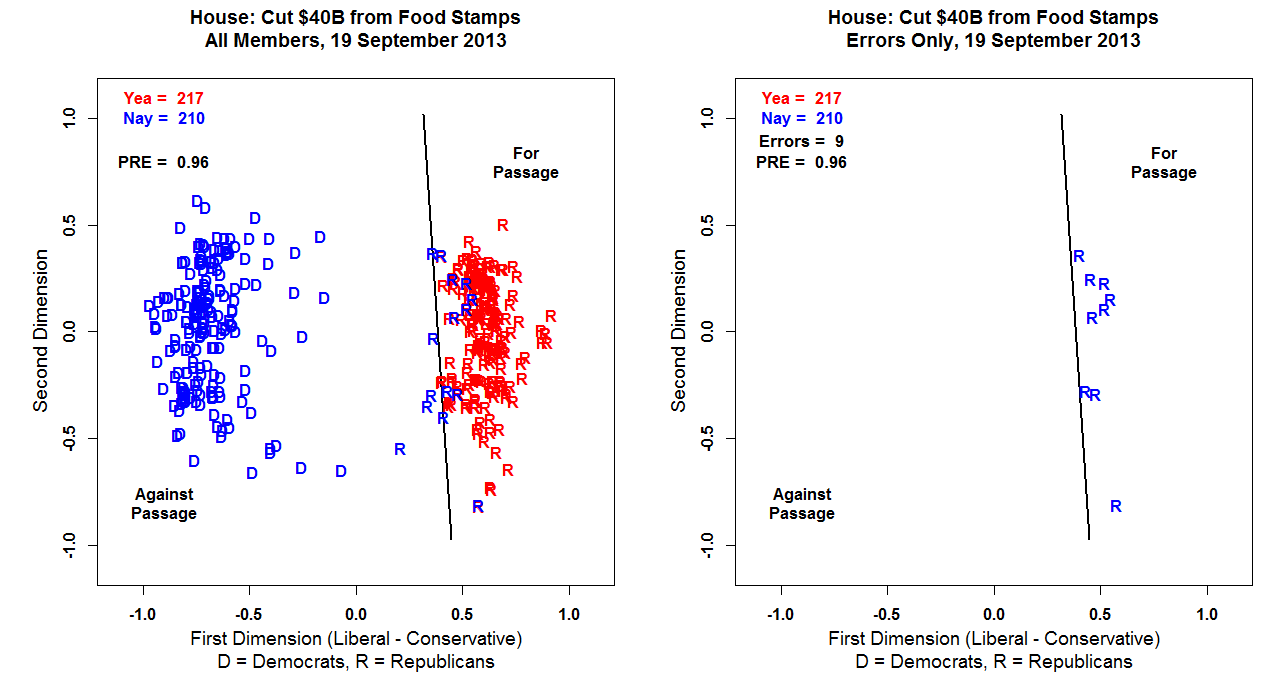
This bill was nearly perfectly aligned on the economic left/right spectrum. With the left wanting to aid the small players in the economy. The right panel shows the errors in the model’s fit. You can notice how there is no overlap between the Democrats and the Republicans. That is unusual from a historical perspective. This model was the first clear way to show that the congress was growing extremely polarized over the last decades.
The meaning of the vertical score has become less clear over the last few years. As for various reasons social left/right issues have tended to condense into the economic issues. It is interesting, and somewhat rare, to see an example vote where the 2nd score has a lot of power.

But what the heck is “Approve the Journal”? Well you can read all about it here. It is the a record of what the house has been up to (votes, conference reports, vetoes, etc. etc.). The voteview community tends to believe that the vertical axis is now measuring some they call insider/outsider – that the people with lower scores are in the outsider group. If so, what we are seeing here is a sort of protest vote by the outsider group.
Remember the second score adds only a little to the model’s quality. I wrote about voteview a decade ago. There you can see how little the second score adds to the model’s fit in that post. I’m not aware of any published data on how that has changed over time.
The voteview blog always gives an interesting clean perspective on current events.