Maybe I don’t read the right blogs but I’m delighted to see a blog post that actually looks at politics from the perspective of the common space scores. The chart below shows the distribution of the scores for various state legislatures (i’ve no idea what the order means):
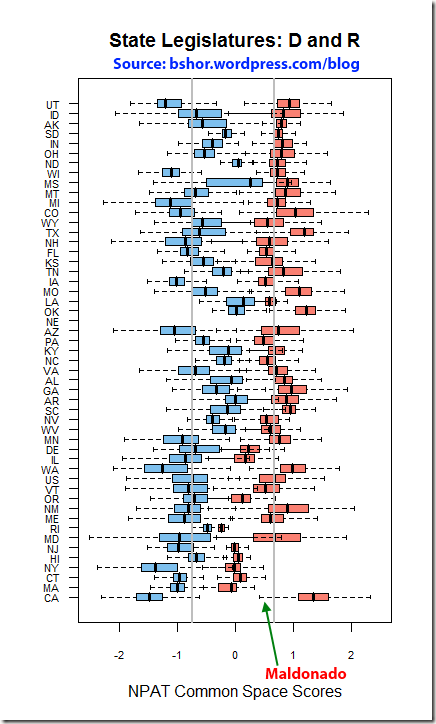
This is a very instructive chart. CA, UT, WI, FL, and WA have no common ground between the parties. I’m surprised they let NJ, HI, NY, RI, and MA Republicans into the hall when national Republicans gather.
California is an object lesson in where we are headed if the nation doesn’t figure out how to back off from the polarization between the two parties. I wonder, does a requirement for a super majority tends to help consensus when there is a large overlap and tends to create an incentive to polarize when the overlap weakens?
(HT: Gelman)
I’m pretty sure the states are ordered by either mean or median ideology score in the state legislature. This isn’t immediately obvious from the graph because the graph doesn’t show the proportion of R vs D.
Fivethirtyeight.com has a fair amount of this sort of analysis, mixed in with some more typical punditry. Andrew Gelman posts there too sometimes.
Sam – That sounds right. Interesting at that point to contrast with the chart here – https://enthusiasm.cozy.org/archives/2008/06/voteview-for-states
It would be fun to have a sense of how far the legislatures are from their population, and from their voting population.