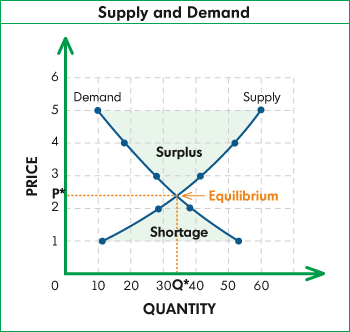
 Back in school when I took economics 101 we would draw these curves showing that if you raise the price you don’t sell as much. In real life I’ve been surprised how rarely this seems to be true. In fact I’ve observed far too many cases where the price goes up and you sell more. Even more common are the cases where the lines are practically flat. I.e. the effect is very weak.
For example much is being made of the fact that miles driven has dropped by 3.7%. The price of gas doubled! Up +100%, down -3.7%
Now some of this is lag. So presumably there is a lot more pent up in the system as people adapt. But you’d think, wouldn’t you?
Chapter 2 in Economics 101 should have been a discussion of demand elasticity. Demand for automobile fuel is relatively inelastic, so while changes in price do have a linear effect on demand, it is scaled down by a coefficient that is less than 1.
Micah – yup.
I wish I’d been taught to draw lines. I remember only writing ON the lines, drawing lines for geoometry and sentence diagramming, and the love pale blue lines creating the manila paper grid of one inch boxes which we were allowed to color — at will! — on rainy days,