These are cool clever animated maps showing bicycle trips. A beautiful example of innovation on open substrate. The maps like these are possible because the US census created maps for the entire nation back in 1980 and then publicly released them. Systems like Map Quest are built on that public good. Get them here, for example. The code stands on a mess of Perl modules for manipulation such things. Just a guy having fun with the oportunities all that created.
 here (zip file). I’ve not used it yet, but the command line API appears quite straight forward. Input regions and population counts for each region; run the software; cartogram regions are output. In addition you get two postscript files so you can check the input/output. Regions are described by the polygon(s).
There is really no end to things you could use that for. Some examples include cartograms of where members, employees, customers reside. Organization charts scaled by various metrics: cost, income, depreciation, education level, etc. Transaction volumes by classification in your web site, your firewall. In many of these cases the topology of the input regions doesn’t necessarily need to reflex something, but if you have something at hand you can use that.
I’d love to see a cartogram of income over the shelf space of a grocery store, or the gates of an airline, or turn over rates.
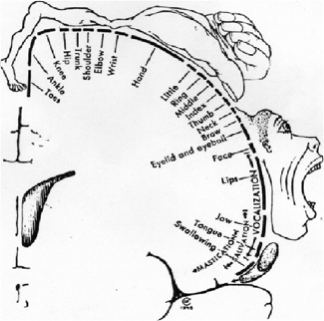
Or how about a cartogram showing the click thru numbers for various links on a web page! If you project an image thru a mapping like this you get a homunculus.