Archive for August, 2006

Housing Prices - Part III

Tuesday, August 29th, 2006

Here’s a chart of housing prices from the NY Times. I’m not entirely sure why it’s so extreme compared to the charts I put up in a previous posting. I suspect part of it is not using a log scale, part is having a much longer time horizon, part is that it’s showing a different index, and finally I suspect that it’s selective about what cities are included; but I still don’t really get it.

The New Supply Chain, same as the Old Supply Chain

Thursday, August 24th, 2006

Chris Anderson’s new book on the Long Tail is finally out. I got a review copy and sooner or later I’ll get around to picking apart my thoughts in some organized manner.

The idea in the book is simple; that there are bottlenecks in traditional supply chains, e.g. shelf space in the record store or movie theaters in your town this friday night. These bottlenecks shape what gets sold. I like his provocative idea that if you eliminated these bottlenecks then something he referes to as the true shape of demand would be revealed.

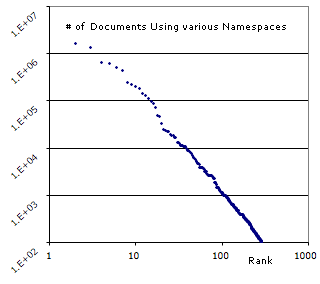
So this is a book about the shape of markets, where by shape we mean the distribution of market share across the set of products moving thru the market. It is refreshing to see that kind of thinking about markets appearing in a book targeted at the air plane business class reading demographic. And further more it’s delightful to see the discussion focus immediately on the issue of where the bottlenecks are; and how they shape the slope and edges of the power-law curves.

It drives me crazy that he appears to be willfully blind to how market players strive continously to create, own, and defend these bottlenecks. While he is enthusiastic in celebrate the freedom created when older bottlenecks are swept away he is entirely silent about the concern that the new bottlenecks might be more or less troublesome than the old ones.

Here, just to take one example, is a nice article in Fortune about how Google holds the fate of so many businesses carelessly in it’s hands now. The elephant doesn’t even notice when it steps on the ants. But actually it’s worse than that. In these Long Tail markets the giants aren’t elephants, they are ant eaters.

House Prices - Part II

Thursday, August 24th, 2006

Here’s some more chart porn of house prices. This chart shows the HPI for five major US cities for aproximately the last 30 years. It shows, for example, that I bought my house at the peak of a price bubble back in the 1980s. Part of the problem here is I don’t really have any idea what to compare this index to, cpi?, gdp?, interest rates?, demographics?, politics?

LA is currently the one with the highest index, it’s also the one who’s bubbling lagged the during the 1980s. Note how housing was a lousy investment during the 90s and to a limited degree the recent run up in prices looks at if it might be compensating for that. You’d see a much wider range of in the recent price runs if you had data for more areas. If you want to play with this data it’s available on this page in various formats for lots and lots of metropolitain regions, they aren’t very picky about what counts as metropolitain.

The Devil’s Long Tail

Wednesday, August 23rd, 2006

In this day and age you really can’t hope to achieve scale with deep relationships, you need broad light relationships that create vast probablistic oportunities for sucess. I’m glad to see that Neil Gaiman and Terry Pratchett know this:

Fourteenth-century minds, the lot of them. Spending years picking away at one soul. Admittedly it was craftsmanship, but you had to think differently these days. Not big, but wide. With five billion people in the world you couldn’t pick the buggers off one by one anymore; you had to spread your effort. But demons like Ligur and Hastur wouldn’t understand. They’d never have thought up Welsh-language television, for example. Or value-added tax. Or Manchester.

He’d been particularly proud of Manchester.

Namespace Usage

Wednesday, August 23rd, 2006

This is yet another of those damn powerlaw scatter plots. This one illustrates the usage (market share?) of various namespaces used in RDF documents. This data is take from here with an overview here.