Mike Konczal has an interesting posting about what becomes of people who are unemployed. I liked most diplomatic observation: “from what I’m seeing the whole idea of dropping out of the labor force from unemployment is completely under-theorized in the literature.”
I naive model might assign each person into one of three categories: employed, unemployed, other. The first two are the labor pool; and other includes prisoners, children, the retired, the idle rich, etc. etc. In this game the dice has three sides, in each round of the game people stand some probability of changing category. So how is the dice weighted? It’s worth pausing at this point and asking yourself; what would guess?
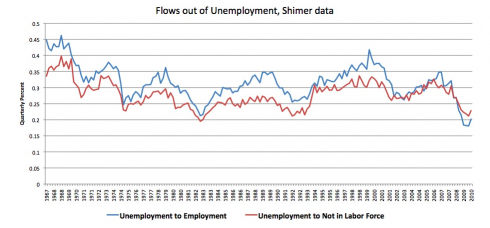
This charts shows that.
It shows the chance an unemployed person will move into one of the other two states. Each round of the game is 3 months, i.e. a quarter. For example in 1967, the left most data point, an unemployed person stood a 45% chance of becoming employed, and a 34% chance of dropping out of the labor pool. The third outcome isn’t shown; the i.e. the 100-45-34 = 21% chance that in the next round of the game he’d still be in the pool.
It’s amazing to me how close these two lines are. You don’t do much damage to generalize: people exit unemployment out both exits with a 50/50 probability. If you want a better generalization you have to look at the size of the gap; he has another chart. You’ll notice those lines cross, but only once.
