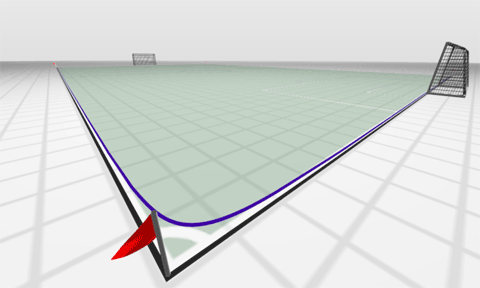
This image is lifted from an article at First Monday (A Practical Model for Analyzing Long Tails).

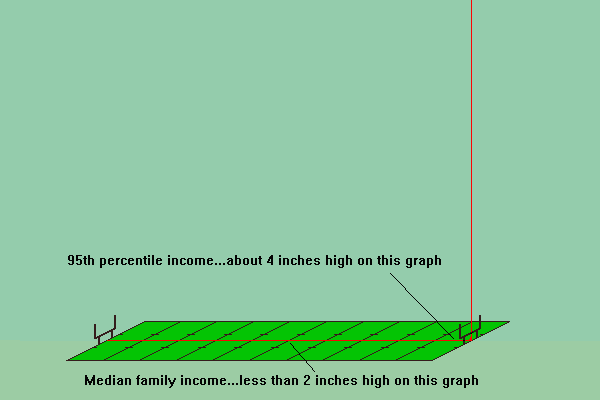
I’d seen this trick of using a sports field to help inform your intuition about power-law curves previously. In that case the distribution of wealth is the topic. These guys talk about the L-curve; shown here (video):

 Both of these do a nice job of helping to visualize the actual shape of these curves. They help to clarify why the politics and business models that serve the two legs are very different and why the appeals that emphasis middle class values are should be treated with some suspicion. The more typical illustration, shown to the right, is preferable if you want to deemphasis the polarization and highlight the uniformity of the underlying generative processes.
Pingback: Perilocity
Pingback: Ascription is an Anathema to any Enthusiasm » Blog Archive » gaze at the moon till I lose my senses
Pingback: Ben Hyde: gaze at the moon till I lose my senses | Server software