That chart should say: $57K per household; or around $500 a month.
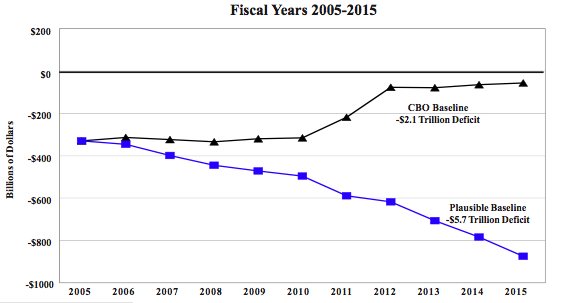
The chart is based on four predictions about the future:
- Government services: track GDP
- War: exit strategy lowers the cost to a third of current levels
- Taxes:
- Alternative Minimum Tax is revised to not bite the middleclass.
- Bush’s tax cuts are extended.
You might be curious about how the Congressional Budget Office is manipulated into making assuptions about those that are so very different. For example why the war is entirely off their books.
Each of these has it’s constituency so you can see how the political battles are going to play out. For example there is $1.7 trillion in the Social Security Trust Fund. For example, at $100 dollars a barrel the Iraq oil reserves are worth $30 trillion.
Or you could come at from the other side and wonder who’s going to lend us that money. Currently Asia governments are said to hold $2.3 trillion of our paper.