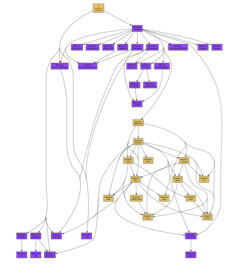
 I’ve been reading the BitTorrent code. Which lead to discovering this nice tool for drawing python module dependency graphs.
The drawing shows the modules of a swarm member in the current beta version (4.1.2) of BitTorrent. In the middle, the brown tangle, is the new DHT (or distributed hash table). Using that a swarm implement their own tracker. The two purple bits on the lower right implement the http server for the tracker. The purple bits on the left include the BitTorrent encoder, or bencode, as well as configuration and argument parsing. The stuff at the top implements the swarm’s collaborative file exchange; e.g. is orchestrating the exchange of pieces over connections with peers at reasonably rates. Here is a pdf version of that drawing.
If you want to use the module drawing tool you really need to subclass it’s main class and fine tune what’s shown. That’s not hard but you probably have to climb the foot hills of both the graphviz and python learning curves. If you enjoy playing with graphviz, as I do, then you can edit’s it’s output before handing it off to the graph layout program. The Macintosh application that wraps up graphviz in a pretty Mac GUI is sweet. (Or, LOL, you could paypal me $998.35, email me your code and I’ll make one for you! Fourth of July sale, mention this ad before the 10th of July and get 10% off!)
Pingback: Ascription is an Anathema to any Enthusiasm » Blog Archive » Visualization
Pingback: Ascription is an Anathema to any Enthusiasm » Blog Archive » Group kinds and metrics