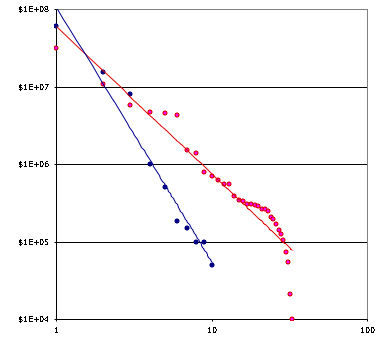
This log-log chart shows the revenue and expenditures for my town; both are aprox. power-law distributed. The revenue sources, shown in blue, are more condensed than the expenditures. The numbers are taken from the proposed budget for the coming year (See this pdf) page C-1).
This next chart and the following table are the ten top revenue sources shown in three formats: a linear chart, a log-log chart, and a pie chart.

| $6.1e7 | Tax Levy |
| $1.5e7 | State Aid |
| $8.1e6 | Local Receipts |
| $1.0e6 | Stabilization |
| $5.0e5 | Overlay Surplus |
| $1.8e5 | Free Cash |
| $1.5e5 | Fy04 Turn Backs |
| $1.0e5 | Hotel Tax |
| $1.0e5 | Antenna Funds |
| $5.0e4 | Elm. Debt Income |
And now the same thing on the expense side.

| $3.1e7 | Education |
| $1.1e7 | Insurance |
| $5.8e6 | C. Pensions |
| $4.7e6 | Safe: Police |
| $4.5e6 | Safe: Fire |
| $4.2e6 | PW Highways & Sant. |
| $1.5e6 | Libraries |
| $1.4e6 | PW: Prop, Cemetary, Nat.Res. |
| $7.8e5 | Comptroller |
| $7.1e5 | Legal |
| $6.3e5 | Safe: Support |
| $5.6e5 | Human Services |
| $5.5e5 | Treasurer |
| $3.9e5 | Redevelopment |
| $3.5e5 | Selectman |
| $3.3e5 | Town Manager |
| $3.0e5 | Safe: Admin |
| $3.0e5 | Building Inspection |
| $3.0e5 | Reserve Fund |
| $2.9e5 | N.C. Pensions |
| $2.7e5 | Assessors |
| $2.6e5 | PW: Motor Eq. Repair |
| $2.5e5 | Street Lights |
| $2.1e5 | PW: Public Works Admin |
| $2.0e5 | Town Clerk |
| $1.7e5 | Planning & Community Dev. |
| $1.4e5 | Personnel |
| $1.2e5 | Postage |
| $1.0e5 | PW Engineering |
| $7.4e4 | Parking |
| $5.4e4 | Registrars |
| $2.1e4 | Zoning Appeals |
| $1.0e4 | Finance Committee |