It’s very odd to be in front of a fad. I’ve spent a lot of time over the last five years looking at the power-law distributions in networks trying to understand the nature of these things. What’s up with elites, the middle class, the poor – or as we have come to call them the long-tail.
One level it’s very exhilarating to have a huge population of people become interested in a topic that fascinates you. But it also involves an odd kind of whiplash. One day your slowly climbing a long tedious learning curve. Off in the distance a few other people are climbing similar hills; you feel a kind of kinship with them. But it’s a big territory and pretty much you all don’t know squat. When the fad breaks a huge crowd rushes into the territory.
This might be great. Many hands make for light work and all that. But the noise level rises and it becomes harder to find the thoughtful ideas. It’s kind of weird how the hordes rush about in this or that region of the landscape; leaving fast territories just as untouched as they were before they all rushed in.
One is torn. Should you continue as before; climbing what ever hills in the problem space that catch your fancy or should you turn and dive into the crowd – where your role would more educational rather than investigative.
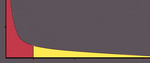 For example consider this first image which is becoming the canonical visualization for the long tail. The idea is that the color regions, the bits under the curve, are the value generated by the what ever process is giving rise to this distribution. The red bits are the elite’s generate value; the yellow bits are the value generated by the long tail. The fad is about realizing that the yellow part can be bigger than the red part; in some cases a lot bigger.
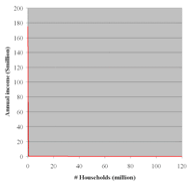
Ok now, look at the real curve. The red line is the whole curve. All the value is in the invisible space between that curve and the x and y axis. The elite value generation is along the y axis while the the poor/long-tail is the value generated along the x axis. That chart is clickable, and here’s another for less political data.
I have a lot of sympathy for the role of the middlemen in the marketplace of ideas. I don’t really see how you can get ideas to move into large populations without their slipping thru the hands of such middlemen. What I don’t get is how bizarre that process really is. Not just that large regions get ignored but even the core of the ideas undergo this severe mutation as they get communicated. Those two drawings are really really different. One is correct, the other isn’t – or a least it is quite a stretch to make it correct.
I can’t claim to being immune to using the exact same rhetorical cartoon. I did it here. If you don’t lie in like this your readers get deeply confused. But, I suspect if you use that cartoon you get get deeply misled as well.
Ben,
Can you make the second graph bigger and clickable?
Thanks
K
Pingback: Sumedh Mungee
Ok, the second chart now clicks thru to it’s source. I didn’t originally do that because I didn’t want to tie the data to a particular instance of the power-law distribution; but what the hay.