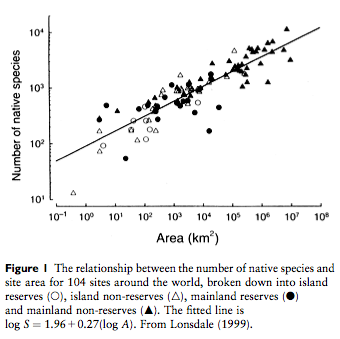
I didn’t know this. The number of species in an ecology is strongly corrolated to the size of it’s zone. If N is the number of species and A is the area then log(N) = c + a*log(A). This paper (and source of the illustration) is a good short overview.
What that curve shows is that if you increase the area an ecological zone by a factor of 10 then the number of species in that area will increase by 186% (i.e. 10^0.27 where 0.27 is the slope of that line).
In turn this allows you to estimate how many species your going to drive into extinction when you decide to take land out of some zone and switch in another; say by filling in wet lands and replacing them with suburban housing.
I wonder where that number, 0.27, comes from?

log (S) = log (c) + z log(A)
where z represents the slope.
What factors influence z?
– Climate, e.g. latitudinal gradient factors
– High average r across the community or group of species
– Habitat complexity
– Isolation, e.g. distance from the mainland
– Type of species represented, e.g. mammals vs. birds