My nation is going back to Iraq. I am deeply ashamed of my nation today. I am afraid of my nation today.

Iraqi solder, last Gulf War
Johnny goes marching…
Leave a reply
My nation is going back to Iraq. I am deeply ashamed of my nation today. I am afraid of my nation today.
Iraqi solder, last Gulf War
I spend some amount of my time working on the problem of identity systems for the Internet. It is a complex problem with Citizens, and Firms, and Goverments, and Non-profits, and Criminals, and Platform vendors, and Incompetent people all messing about.
All those parties are attempting to find solutions in the face of very powerful forces. Forces making storage, computing, and communication rush toward vanishingly cheap. Forces that are dragging more an more info about your personal, employement, financial, travel, etc. etc. life out onto the web – in a rush to make things more efficent for you and the organizations you interact with.
Bad guys can do bad things with that data, and it’s getting easier and easier for them to search it out. Most systems protect the data by demanding that you provide a little info about yourself to prove to them your who you claim to be (or at least somebody who knows you well). For example they might ask for your birthday or your social security number, maybe your place of birth. It’s just random personal stuff and as privacy breaks down that stuff becomes easier for a bad guy to figure out.
For example the University of Texas had a web site which let you get access to your info by providing a little info – in this case your social security number. Well that was a mistake. A bad guy proceeded to try one number at a time. Searching the entire space of social security numbers? With 9 digits in the social security number that’s a billion tests – a pretty big number even today for trying one at a time over the web.
Lucky bad guy! Turns out the social security numbers handed out in one geographic region come from the same block of numbers. So he focused his attention on the Texas blocks.
A sad irony that “social security” is creating one of the more common ways to create insecurity for people’s identity.
This is a hard problem. It’s going to be very hard to fix!
As the mayor of New York comes clean on his membership in the hyper-upperclass he oil’d the water: ‘we should get over it.’ We? Well he did distributed 2% of the wealth (i.e. 100Million dollars) to charity; but since his wealth rose by 400 Million he appears to be falling behind.
Maybe this would be a good time for Mitt Romney, my Governer, came clean as well. That would be a good step before he follows thru on his plan to sell the state university system to private developers.
Crooked politics on the left pay their supporters with jobs, crooked ones on the right sell off public assets to their friends.
There is a lovely pattern that arises in science from time to time. You measure something, notice something, fit a model to it and discover something you really didn’t know before. It’s hard to believe that such a thing could happen in Political Science. But now it has.
Some years ago it became popular to wisely opine that there was no difference between the two political parties in the United States. The dangerous consquence of this line: “Why bother voting.”
Can we prove this argument true or false? Yes.
Some years ago Keith Poole and Howard Rosenthal asked a surprisingly simple question. Can we reduce all politics to a single number? Such a number might, for example, measure how liberal-conservative our elected officials are.
This is a statistical question: e.g. given that model how well does the data fit? A computer problem. You write, or acquire, a computer program that chews on the data and tells you how well it fits your model.
So they set out to see if they could assign a senator or congressman a number and then use that single number to predict how they would vote on any given bill.
My sense is that when Poole and Rosenthal first asked this question they assumed that answer would be a “no, not really.” I think they hoped that later when they added a few more numbers to measure a representative’s belief system then they would start to get better models. Models that fit better and better.
Of course any student of political science knows a laundry list of reasons why representatives vote in ways that are not well aligned with their core beliefs. Just a few examples: log rolling (voting in one period to get something in a later period), party loyalty (voting with the party to gain the benefits of loyalty), pork barrel (voting to benefit your region), bribery (voting to benefit those who paid for your campaign), etc. etc.
Poole and Rosenthal took the historical record of votes in the Senate and tried to fit their very simple model to it. The idea was that every representative would get a number and every bill they voted upon would too. The bill’s number would slice thru space of Senators and those on one side would vote for it, and those on the other side would vote against it.
For example Senator Lefty might have be assigned -2, and Senator Righty might get assigned +3. If a bill was slightly to the right at 1, then Senator Right would vote for it and Senator Lefty wouldn’t. But a bill that was extremely leftish, say nationalize the computer operating system business might be at -4 and niether of them would vote for it. Pretty dumb model huh?
The statistical problem, the one they handed over to the computer program they wrote, is to find the best numbers for all Senators and all the bills. The model that generates the fewest errors. If you get a lot of errors the model is crummy, if you get a few then the model’s pretty good.
You want it to find the best definition of left/right. When doing this you don’t want to bias the program’s output. Notice that if you have 50 senators and you want to put them in order from left to right there are N!/2 possible orderings, or around 10 with 64 zeros following it, that’s a big space to search. Between 1789 and 1985 the Senate held around 40 thousand roll call votes. That’s around 2.3 million times some Senator made a decision. This must have been a fun program to write.
One reason they started with such a lame model was that the problem is so huge. The second reason they did the project was they were offered time on a big computer and they were looking for a Political Science problem to tackle.
What Pool and Rosenthal found was that they could use a single number to explain around 82% of the votes. They must have been amazed.
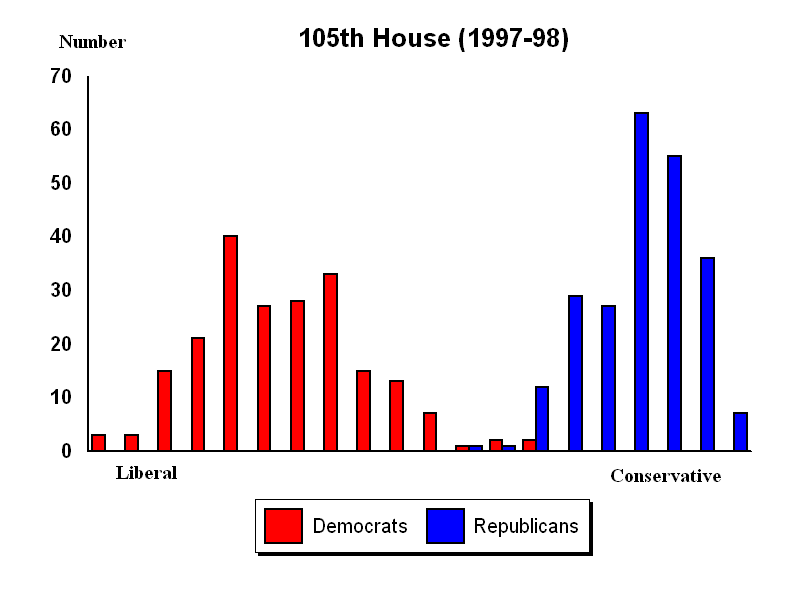
Here’s an example. This chart (taken from this paper) shows the distribution of representatives in the congress in 1997-98.
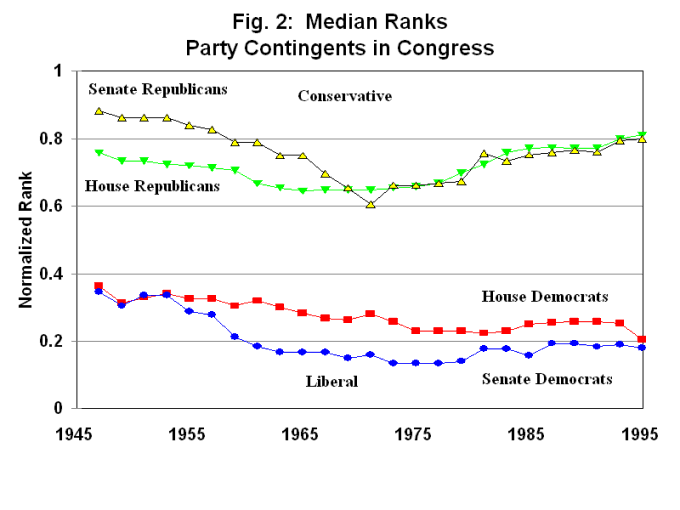
You can also plot the data over time, as shown in this graph (take from this paper) of where the median of each party’s representative is from 1945 thru 1995.
Later when computers got bigger they were able to try two and three numbers. They are very slightly better. Adding a second dimension only improves the model’s fit by 2%, but it adds a lot to our understanding of the what these numbers mean.
Here is a chart (taken from this source) plotting the position of all the senators in the 85th senate. This is 1957-1958. The civil right’s movement was on the horizon and all hell is about to break loose. The R points are republican senators, D are democratic senators, and S are southern
democratic senators. If you were designing a bill to get it past this senate then you would craft it to slice the space thru the middle with line slightly tilted clockwise.
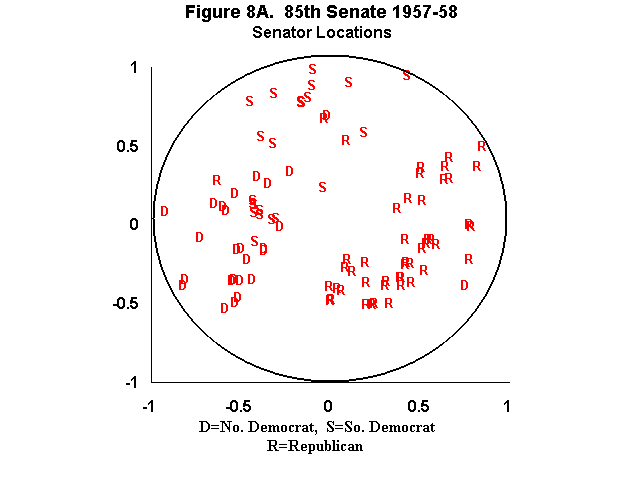
Of course to design your bill you’d need to know what the axes mean. The computer won’t really tell you that. It just found a model that fits. What do they mean? Some guesses might include: liberal/conservative, north/south, black/white, poor/rich, democrat/republican, urban/rural. Clearly we could go on and on!
Well it turns out that the horizontal axis is about the regulation of commercial activity. Goverment does many things that structure the markets that commercial activity takes place within. Setting standards, printing currency, writing the regulations. The key to the left/right axis is the extent such regulations serve small vs large players in the economic arena.
Consider a bill that regulates industry to make the workplace safer. When crafting the bill we could decide to have the bill affect all companies with more than 100 employees, or alternatively all companies with more than 20 employees. The representatives on the left will prefer more worker safety, the ones toward the right will prefer less industrial regulation.
It turns out that for most of American history the vertical axis is about race. The southern Democrats on that chart are were once called “dixicrats”, they supported regulating commercial activity, but they didn’t have much enthusiasm for voting rights for black citizens.
I can not even begin to enumerate how amazing this work is. For example there are numerous widely known models of how politics is played in this country. Models that this data allow you to check. For example it’s widely assumed that representatives on a given committee don’t represent the position of the congress at large because they have special interest in the work of the committee. The model show that’s not true. For example it’s widely assumed that representatives shift their positions over time as the opinions of the general population shift – that’s absolutely not the case. In fact it appears there is really nothing as consistent as a representative.
The hardest idea to get your head around that this model implies is that any issue, the environment, for example must be projected into this model before the vote takes place. There is no such thing as a highly pro-enviromental right wing representative!
The model also allows them to watch the congress evolve over the centuries. To see when there were significant shifts in the population of representatives; and hence upheavals. You can see periods when the two parties overlap; and periods when they are highly partisan. For example the parties grew very partisan running up to the civil war, and we are currently living in a period that is the most partisan since that time.
The book is not for the casual reader. Someday soon, hopefully, a more accessible popular version of this will come out. To get a taste for how the book reads you can read this
article about the recent mess that Senator Trent Lott got himself into.
This Amusing Rant provides food for thought when thinking about the Bush administration’s rush to hand over the keys to various Goverment assets to their friends. Me? I’ve diversified some of my retirement savings into Euro denominated investments.
Bertrand and Mullainathan’s paper showing how a white sounding name vs. a black sounding one is far more likely to get called back when submitted on a resume just won’t get out of my head!
Table 2, on page 30 of this paper has a table I just can’t stop thinking about. It reports that if Brad submits a hundred resumes he will get 16 calls, while Rasheed can expect to get 3.
People like to talk about how hard working and dedicated immigrants are. Well now we know why Rasheed’s so hard working. He’s scared! He’s going to have to work five times harder than Brad to find a new job if he looses the one he’s got.
It suggests something about why there seem to be so few participants of non-european ancestry involved in Open Source. They are common in Silicon Valley. Just maybe they don’t want to take the risk.
Back in the late 1970s I worked for an venerable research firm. BBN, a lot of smart folks doing interesting work. The firm was generally profitable. It never managed to make any big money.
That firm was wiped out in what Fligstein in Architecture of Markets describes as a shift in how we as a society conceptualized firms. In 1970s firms were measured by how effectively they leveraged their assets. In the late 1970s that model was thrown into chaos by high inflation rates.
Chaos often results in changes of self concept, and so it was with society’s model of firms. Two complementary ideas arose in the early 1980s. One was that the right measure of a firm was ‘shareholder value’; i.e. the amount of money a firm returns to it’s investors. The second was the creation of a siginificantly more fluid market for the control of firms (e.g. Regean era reductions anti-trust enforcement, and reduced corporate taxes).
BBN thrashed around for a while after that. Finally it got senior management that understood the new rules; even if the smart guys never did. Finally it sold out to a telecomm company. The shareholders made some money and the firm was destroyed.
Today in my inbox I have email from the alumni mailing list of BBN. One of the last remaining bits of the firm recently went bankrupt. Some of those smart folks are now losing thier health insurance. Cobra coverage is one of those pesky liablities a bankrupt firm can shed.
The recent news stories, reporting the arrest of some crooks who apparently stole the identities of tens of thousands of people, pull my cord. There are three aspects to this story I feel are not getting sufficiently reported.
First. The victims have no effect way to recover their lives. Once your identity is stolen repairing it is nearly impossible. This is a horrific breakdown that is entirely the fault of the financial industry and it’s partners in state and federal goverments responsible for regulating the industry.
Second. Consider a principle of property law. A property owner need not take particular care to protect trespassers from injury on his property, but the so called “attractive nuisance doctrine” is the exception. If the property “invites” the trespasser by virtue of its attractive nature then the owner become libel. Children (and the stupid) are the part of the public the law is attempting to protect with this doctrine. This is why we put fences around swimming pools and why we don’t leave guns in the bed side table. It would be a crime not to.
Most of the reports about this crime point the finger of blame at the crooks. I think if you: pour gasoline all over a room, leave matches on the table, and then let a few million people wander thru. I find it very hard to argue that the idiot who lights the match for the resulting fire.
Third. $60.00 each. That’s all the crooks got when they sold each person’s identity. That’s it. That’s all your identity is worth in the open market.
The crime here was a failure to regulate this industry. A failure to work with the financial industry to keep a lid on this mess. A nearly total lack of effort to temper the misery it inflicts on innocent people.
The polls have been closed here for 40 minutes. When does the Supreme Court tell us who won?