A bleak but facinating example of a power-law distribution. The first drawing shows one data set from events in Iraq along with another for events in Columbia.
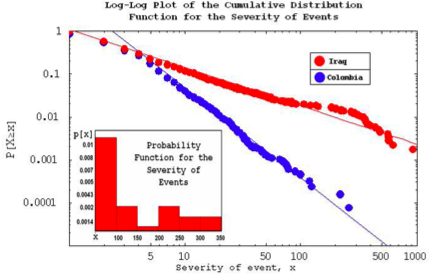
The vertical is how awful the event was. Iraqi conflict is less severely skewed than the Columbian. Adopting the terminology of wealth distribution you’d say the Iraqi conflict is more equitably distributed.

The second chart is a rare catch. It’s plotting alpha, i.e. the slope of the power-law over time.
The article via kolmstead and the powerlaw tag at del.icio.us.
The frequency-intensity distribution of fatalities in “old wars”, 1816-1980, is a power-law with exponent 1.80. Global terrorist attacks, 1968-present, also follow a power-law with exponent 1.71 for G7 countries and 2.5 for non-G7 countries. Here we analyze two ongoing, high-profile wars on opposite sides of the globe – Colombia and Iraq. Our analysis uses our own unique dataset for killings and injuries in Colombia, plus publicly available data for civilians killed in Iraq. We show strong evidence for power-law behavior within each war. Despite substantial differences in contexts and data coverage, the power-law coefficients for both wars are tending toward 2.5, which is a value characteristic of non-G7 terrorism as opposed to old wars. We propose a plausible yet analytically-solvable model of modern insurgent warfare, which can explain these observations.
The link to the article is not working anymore.
Maybe you are referring to this paper:
http://arxiv.org/abs/physics/0506213
or
http://arxiv.org/abs/physics/0605035
Cheers,
Pietro
The 2nd paper you point to is later and better. I don’t recall which one I read back in the day.