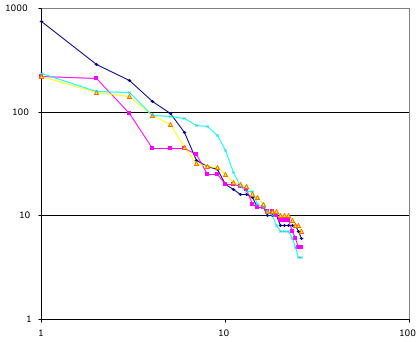
Following up on something Clay mentioned the following chart plots the distribution of tags for four popular URI at del.icio.us. Each line is the tags assigned to one URI. Each point is one tag, the vertical axis is how many times that tag was used to label that URI. The more popular tag for a URI is on the left; the least on the right. Note the power-law distributions.
I’m extremely surprised that the slopes are so similar. Of course a sample of four isn’t very large. If tags were drawn at random from the english language the slope would be slightly larger than -1. I’d assume that as the page becomes more focused the slope becomes more extreme. So that is, I guess, a hypothisis that if you find all the pages with more than 500 tags and extract for each of them a score, i.e. the negative of their slope. The high scoring ones are very focused while the less focused ones are more generic; i.e. scattered over the space of all things tag-able in english.
The audience of del.icio.us readers presumably is also critical in determining the slope. If they are all java programming, web site hacking, 20-30 year old geeks then that certainly imposes a high degree of focus. Or if you like message discipline.
Sadly I don’t see a trivial way to find a random set of pages with more that 500 tags.
Update: More here.
Saw this via JOHO. Thanks for the data. The game is still early. I’d like to see more creative terms that focus a topic. Not just “blogs” but blogbunk, a collection of the blog triumphalism that’s been bandied about, along with some healthy sprinkles of skepticism. It’s a tag with a purpose, a meaning, a direction.
Pingback: La Taberna del Turco » FolcsonomÃas
Pingback: P.S.: » On Tag Clouds, Metric, Tag Sets and Power Laws
Pingback: Csaba’s Blog » Emerging patterns