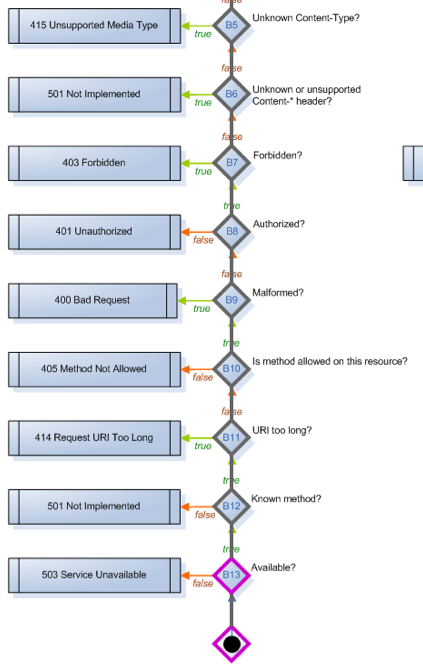
Recently I’ve been taking a recreational climb up the Erlang learning curve. I’ve been up this hill before, it’s a lovely walk. This afternoon I took a restful detour to see one of the sights. Gosh, it’s so pretty. Webmachine an elegant implementation of an HTTP server (code and wiki, blog, talk and video) written by Andy Gross and Justin Sheehy from Basho Technologies along with numerous contributors. Bryan Fink added this lovely view, a flow chart for visualizing a HTTP request:
 The slightly darker line in that traces out a single very simple request; it starts on the lower left, rises up and flows down in a staircase until right at the end it turns back and into a box which you might notice is outlined in red. That is the end state, the 200 OK response.
Back when I was actually sculpting web servers out of blocks of raw bits my white board had baked on drawing like that, but mine wasn’t as nicely laid out. There are other ways to get it right, but most serious HTTP server implementors have, or at least had, some version of that which haunted their dreams. These folks have been doing their homework.
What make’s Bryan drawing totally amazing is that that it is traced out an actual request. One my instance of Webmachine did a few minutes ago. It’s drawn onto a canvas element. Tracing is cool, but wait, there’s more!
You’ve doubt heard about how Erlang’s a functional language, which to the naive listener means no side effects. But here you get to see what that can enable.
 Unsurprisingly as that request is handled the http server has a data structure which represents the request, and as the trace proceeds that state matures until finally a response can be sent. For example at some point it has to pick what character set to respond in, while at another point it needs to pick if and how to compress the result. So all HTTP server’s I’m familiar with have a request data structure around which this process is organized.
Because Erlang is a functional language each time we augment the request state we actually create a fresh data structure (bla, bla, bla, sharing substructure, whatever). Which makes it easy for the trace to record how the request state looked at each step along the way.
Bryan’s trace is alive. If you click on nodes in that graph it will show you what request state function got and produced. Which I must say takes all the challenge out of writing this stuff.
The win here is that you can quickly make sure your resources are served up in ways that actually use all the sweet features in HTTP.
