A big thick thesaurus used to be one of my most beloved possessions. I kept one on my desk at work and a 2nd copy near my chair at home. I used it daily; not as a writing aid but as means to expand my thinking on a topic. So clearly I’m the perfect audience member of this lovely talk about mapping the content of a thesaurus over time.
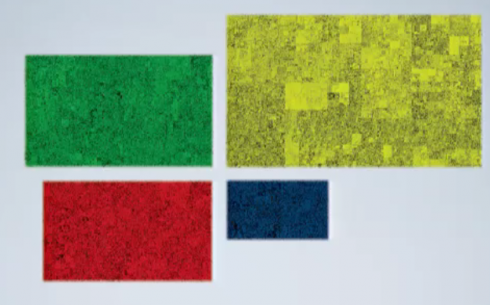
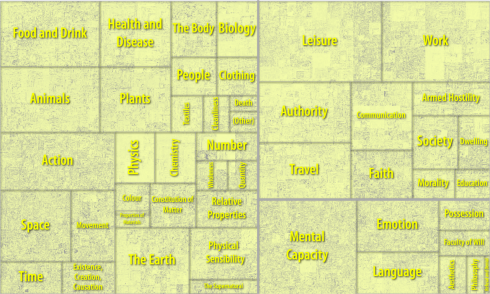
That shows four snapshots over time of the English language. The older rectangles are smaller – so old to new is blue, red, green, and the most modern is yellow. Individual words are points in the rectangles. The rectangles are treemaps based on the outline of the thesaurus. In the yellow/modern rectangle sharp boundaries appear in the coloration between branches in that outline. Notice how homogenous language used to be. I think that reveals when the categories were designed; you see something similar with the dewey decimal system.
The shading denotes how old words are; the black bits are old words. The lighter bits show were the language has expanded, the fabric has stretched.
At the end of the talk he tosses out provocative hints of other things you could do with the data. Thomas Jefferson hung out on this landscape talking about football. Metaphors cut highways across this territory. Moral courage is on the decline.
The author is Mark Alexander and his tumbler account has more pretty pictures and charts. I’ve often wished that libraries had a tree map of their collection near the front door.

